

North Wales and the Midlands boundaries
The Western transmission region includes boundaries in the Midlands and the north of Wales. This includes the lower Midlands boundary B9 and the north Wales boundaries NW1, NW2 and NW3.
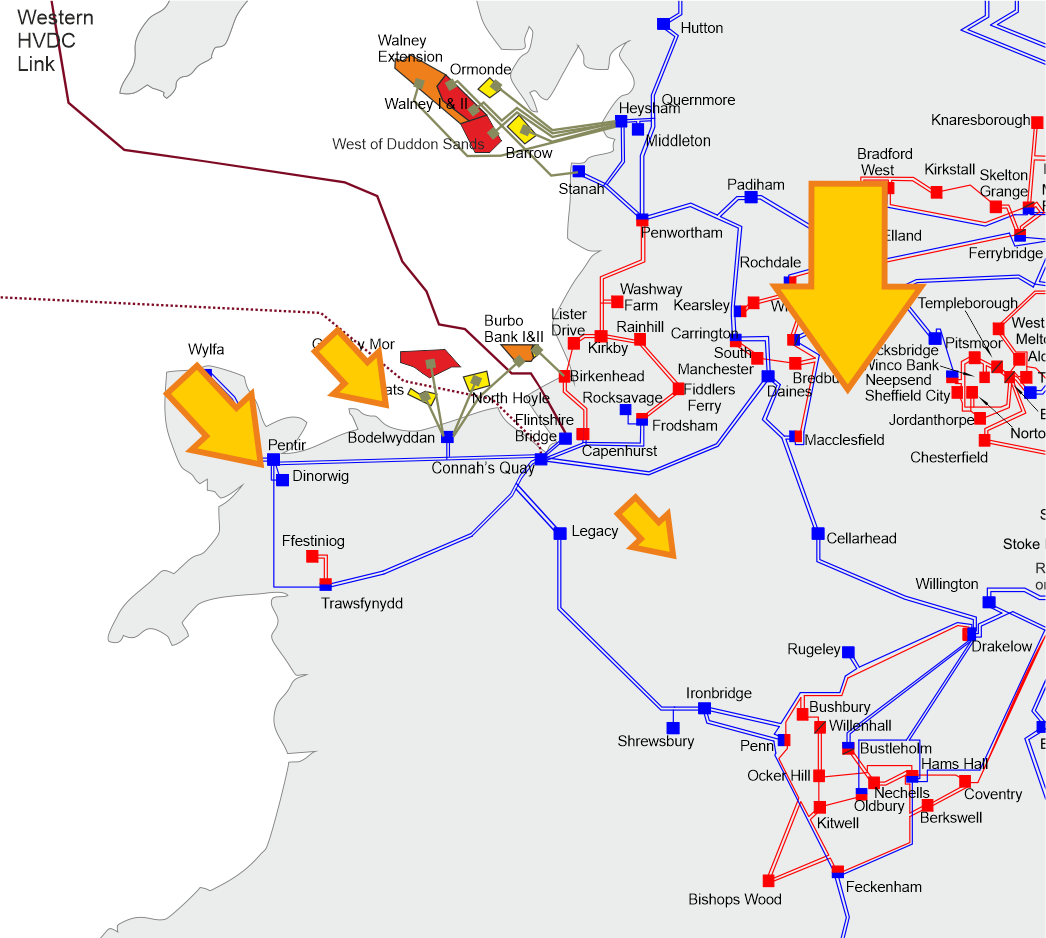
The map below shows the general pattern of power flow directions expected to occur most of the time in the years to come up to 2033, i.e. power will generally flow from north to south. The arrows in the diagram illustrate power flow directions and are approximately scaled relative to the winter peak flows.
Regional thermal drivers – North Wales and the Midlands
Power plant closures are set to occur in the Midlands with demand set to remain fairly high, driving increased power flows eastwards from future generation connecting to North Wales.
The FES scenarios suggest a total amount of transmission-connected generation capacity to be between 16GW and 23GW by 2030, from the current 18GW. For all scenarios other than "Falling Short," fossil fuel generation is not present in the region by 2050.
Presently, this region has a significant volume of fossil fuel (totalling around 14GW). However, by 2030 all scenarios show a decline in fossil fuel generation capacity with slight growth in interconnectors and storage alongside a significant growth in low-carbon technologies, especially offshore wind and carbon capture and storage (CCS) generation. The gross demand as seen from the transmission network in the region will increase across all scenarios. As with other regions, this is driven by the adoption of technologies such as electric vehicles, heat pumps and embedded storage. Across all scenarios, this region maintains a relative balance between its growth in both gross demand and transmission connected generation capacity up to 2030.
Following 2030, North Wales and the Midlands is expected to generally export power due to the connection of offshore wind projects facilitated by the HND and HNDFUE.
The need for any new network reinforcement to address the potential capability limitations will be evaluated in the TCSNP2 following input from Transmission Owners and other interested stakeholders. Following the evaluation, recommendations on reinforcements for the North Wales and Midlands region will be published.


Regional voltage drivers – North Wales and the Midlands
Following the closure of power stations in West Midlands region, we face challenges in managing voltage due to limited reactive compensation in the 275kV network, and the sensitivity of voltages to system flows.
This region relies on reactive compensation which exists far away and are thus not very effective. In the summer months due to low demand and the long transmission lines in the region, some areas experience high voltage. Looking ahead, this region sees limited growth in generation across all FES scenarios. This coupled with potential closure of fossil fuel generation in the region could make it increasingly challenging to manage the region’s voltage.
The map below shows the West Midlands identified through our voltage screening process.

Download a larger version of this image
Boundary regions
Click on the regions below to expand the boundary and understand its capability and challenges.
If you would like to learn how to interpret the graphs, click the button below.
The graphs show a distribution of power flows for each of our Future Energy Scenarios, in addition to the boundary power transfer capability and NETS SQSS requirements for the next 20 years.
Each scenario has different generation and demand so produces different boundary power flow expectations. From applying the methodology in the NETS SQSS for wider boundary planning requirements (as discussed in the previous chapter), we determine for each scenario:
- The economy criteria - solid coloured line
- Security criteria - dashed coloured line
- Current and future NOA capability (where available) - solid red line
The capability line (red line) is based on the recommendations from the Beyond 2030 report. More information about the NOA methodology can be found here. The 50%, 90%, economy required transfer (RT) and Security RT are calculated from the 2023 FES and ETYS processes. Where the NOA transfer capability is not available, there is a red line that provides the transfer capability from ETYS 2022.
Note: Boundary capability line is affected by the generation and demand profiles within each FES background. Therefore, the graphs are provided for indicative purposes only and cannot be directly compared.
The calculations of the annual boundary flow are based on unconstrained market operation, meaning network restrictions are not applied. This way, the minimum cost generation output profile can be found. We can see where the expected future growing needs could be by looking at the power flows in comparison with boundary capability.

View an interactive version of the graph
On each graph, the two shaded areas provide confidence as to what the power flows would be across each boundary:
- The darker region shows 50% of the annual power flows
- The lighter region shows 90% of the annual power flows
From the regions, we can show how often the power flows expected in the region split by the boundary are within its capability (red line). If the capability of the boundary is lower than the two regions over the next 20 years, there might be a need for reinforcements to increase the capability. However, if the line is above the shaded regions, it shows that there should be sufficient capability here and that potentially no reinforcements are needed from a free market power flow perspective until the shaded regions exceed the capability (red line).
Highlighted yellow areas on our NETS regional diagrams will show areas identified through our voltage screening process on the NETS that could face voltage needs over the next ten years. These areas have been identified through our annual voltage screening process outlined in our "About the ETYS" section and is included in our NOA methodology. These charts will be accompanied by a general commentary surrounding voltage behaviour in the regional area.
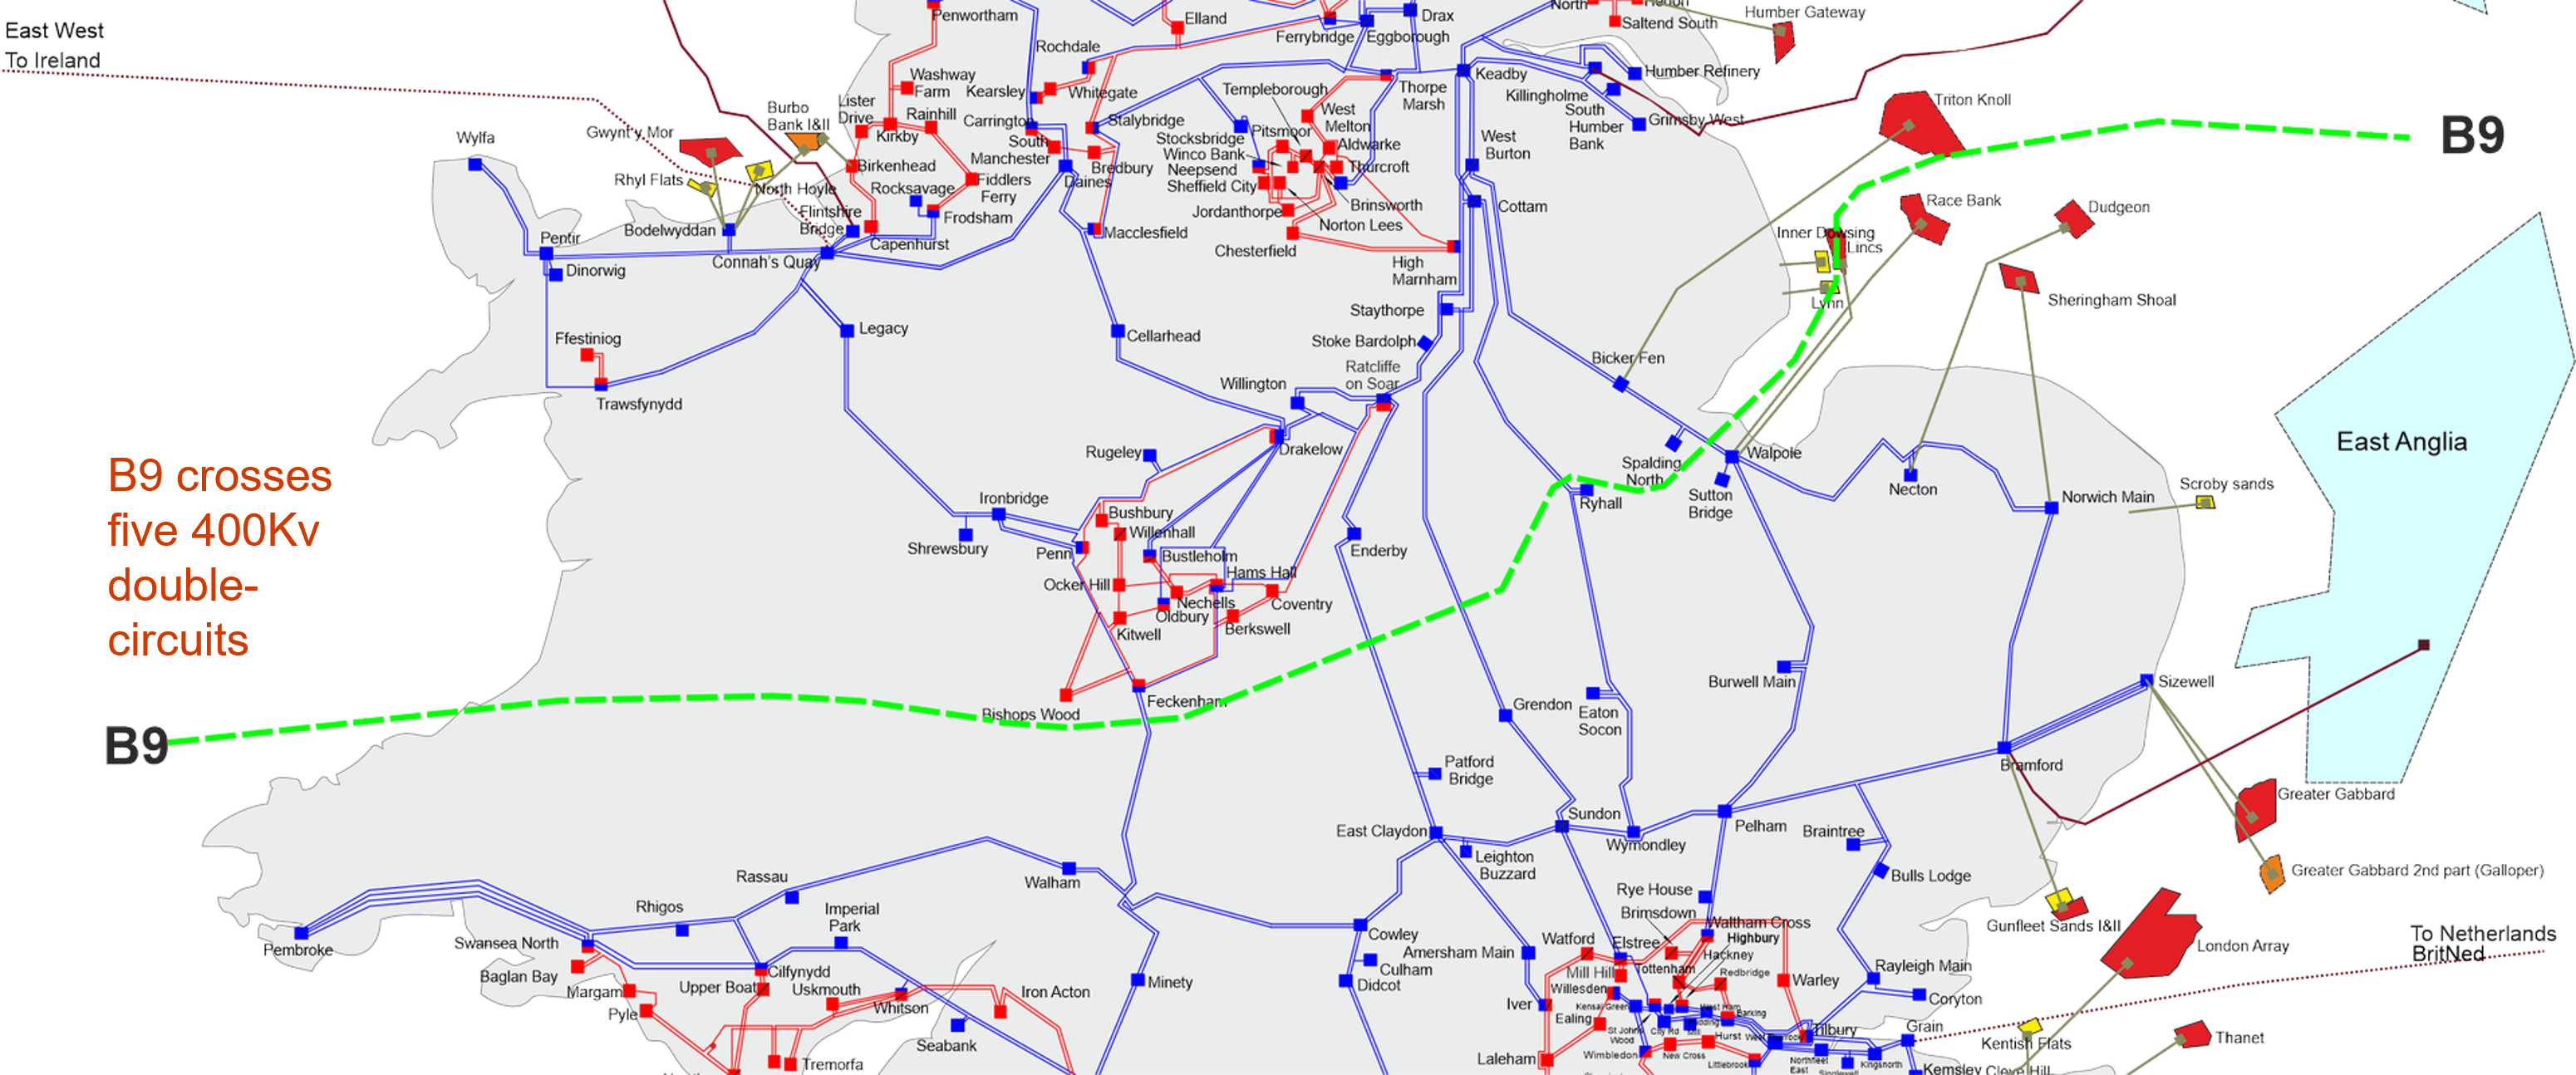
Boundary B9 separates the northern generation zones and the southern demand centres.
Boundary flows and base capability

View an interactive version of the graph
The capability line (in red) is based on the recommendations from the Beyond 2030 report, which uses the 2023 FES and ETYS data as inputs. The 50%, 90% Economy RT and Security RT lines are based on FES 2023. The ETYS and NOA methodologies for this boundary are different and can result in different transfer capabilities.
The boundary capability is limited to 12.5GW due to a voltage constraint for a fault on the Enderby-Ratcliffe on Soar double-circuit.
Developments in the east coast and the East Anglia regions, such as the locations of offshore wind generation connection and the network infrastructure requirements, will affect the transfer requirements and capability of boundary B9.
In all four scenarios, the requirements gradually increase to above the boundary capability for B9. The increase is more than last year showing a need for additional boundary capability in the future for three out of the four scenarios.
North Wales
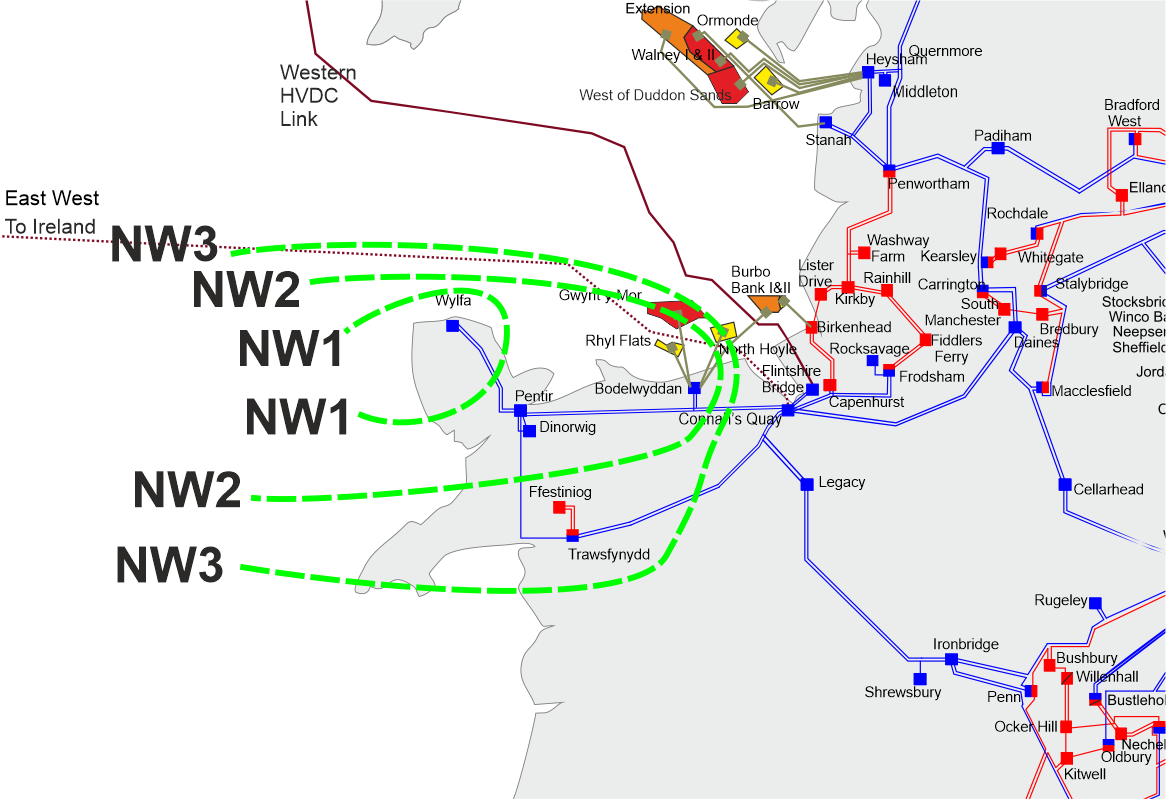
The onshore network in North Wales comprises a 400kV circuit ring that connects Pentir, Connah’s Quay and Trawsfynydd substations.
A 400kV double-circuit spur crossing the Menai Strait and running the length of Anglesey connects the now decommissioned nuclear power station at Wylfa to Pentir. A short 400kV double-circuit cable spur from Pentir connects Dinorwig pumped storage power station. In addition, a 275kV spur traverses north of Trawsfynydd to Ffestiniog pumped storage power station.
Most of these circuits are of double circuit tower construction. However, Pentir and Trawsfynydd within the Snowdonia National Park are connected by a single 400kV circuit, which is the main limiting factor for capacity in this area. The area is studied by analysing the local boundaries NW (North Wales) 1 to 3.
Boundary regions
Click on the regions below to expand the boundary and understand its capability and challenges.
Boundary NW1 encloses the Wylfa 400kV substation.
Boundary flows and base capability

View an interactive version of the graph
The capability line (in red) is based on the ETYS base (year 1) transfer capability, using the 2022 FES and ETYS data as inputs. The 50%, 90% and Economy RT lines are based on FES 2023. The ETYS and NOA methodologies for this boundary are different and can result in different transfer capabilities.
The boundary capability is limited by the infrequent infeed loss risk criterion set in the SQSS, currently 1.8GW.
There is currently very low amounts of transmission-connected generation behind NW1 following the closure of Wylfa power station in 2015. However, there are some renewable and storage plants. Due to this low generation behind the boundary it is expected within the later years for NW1 to become predominantly importing.
Boundary NW2 encloses NW1 and the Pentir, Dinorwig, and Bodelwyddan 400kV substations.
Boundary flows and base capability

View an interactive version of the graph
The capability line (in red) is based on the recommendations from the Beyond 2030 report, which uses the 2023 FES and ETYS data as inputs. The 50%, 90% Economy RT and Security RT lines are based on FES 2023. The ETYS and NOA methodologies for this boundary are different and can result in different transfer capabilities.
The boundary capability is limited to 1.4GW due to a thermal constraint on the Pentir–Trawsfynydd single circuit.
Currently, there is not a significant amount of generation behind NW2, mainly pumped storage and offshore wind projects.
Expected transfers across NW2 post-2029 have decreased since the ETYS 2022 publication due to changes in expected landing points for new offshore wind generation.
Boundary NW3 encloses NW2, Trawsfynydd 400kV substation, and the Ffestiniog 275kV substation.
Boundary flows and base capability

View an interactive version of the graph
The capability line (in red) is based on the ETYS transfer capability using FES 2022 data, described below. The 50%, 90% Economy RT and Security RT lines are based on FES 2023.
The boundary capability is limited to 5.5GW due to a thermal constraint on the Connah’s Quay–Bodelwyddan–Pentir 400kV circuit.
The profile of NW3 is largely similar to that of NW2, with no significant volumes of generation currently anticipated to connect at Ffestiniog or Trawsfynydd substations in the future.