Skip to main navigation
Home
ESO
  • ESO
  • Group PLC
  • NG in the UK
  • NG in the US
  • Careers
  • Investors
  • Data Portal
  • Calendar
  • News
  • Contact us
  • Back
  • Who we are
    • Back
    • Home
    • Who we are
    • What we do
      • Back
      • Who we are
      • What we do
      • Work with us
      • Our people
      • How we're organised
      • How we're regulated
      • Meet the board
      • Our Executive Team
      • The Future System Operator (FSO)
      • Stakeholder groups
      • Our global network
      • Compliance statements
    • Electricity National Control Centre
      • Back
      • Who we are
      • Electricity National Control Centre
      • What does the Electricity National Control Centre do?
      • What is the Balancing Mechanism?
      • How does the ENCC handle severe weather?
      • What does a day in the ENCC look like?
      • Operational Transparency Forum
    • Electricity Markets
      • Back
      • Who we are
      • Electricity Markets
      • Electricity markets explained
      • Publications and projects
      • The role of the ESO Markets team
  • Electricity explained
    • Back
    • Home
    • Electricity explained
    • What is electricity?
    • How is electricity generated?
    • How does electricity move around?
    • How do we balance the grid?
    • What to do in a power cut
    • How is electricity priced?
    • Electricity and me
    • Monthly Insights
  • A net zero future
    • Back
    • Home
    • A net zero future
    • Our progress towards net zero
      • Back
      • A net zero future
      • Our progress towards net zero
      • Carbon Intensity Dashboard
      • Road to Zero Carbon report
      • Road to Zero Carbon in numbers
    • Our net zero work
      • Back
      • A net zero future
      • Our net zero work
      • Future Energy Scenarios (FES)
      • Virtual Energy System
      • Innovation
      • Projects
      • The Pathway to 2030 Holistic Network Design
      • Empowering climate action
      • Bridging the Gap to net zero
      • Our RIIO-2 plans
    • Net zero explained
      • Back
      • A net zero future
      • Net zero explained
      • What is net zero and zero carbon?
      • Renewable energy
      • Electric vehicles
      • What is carbon intensity?
  • Industry information
    • Back
    • Home
    • Industry information
    • Connections
      • Back
      • Industry information
      • Connections
      • Our role in connections
      • The connections offer process
      • Your connections journey
      • Reports and registers
      • Connections Portal
      • Use of System (UoS) and Virtual Lead Party (VLP)
      • Connections help and support
      • TEC Amnesty
    • Balancing Services
      • Back
      • Industry information
      • Balancing Services
      • Future of balancing services
      • Demand Flexibility Service
      • Frequency response services
      • Reserve services
      • System security services
      • Reactive power services
      • Trading
      • Settlements
      • Local Constraint Market
      • Balancing Mechanism Wider Access
      • Electricity System Restoration Standard
      • Power Responsive
      • Balancing programme
      • Single Markets Platform
    • Charging
      • Back
      • Industry information
      • Charging
      • Balancing Services Use of System (BSUoS) charges
      • Transmission Network Use of System (TNUoS) charges
      • Assistance for Areas with High Electricity Distribution Costs (AAHEDC)
      • Connection charges
      • Charging guidance
      • Charging policy developments
      • Charging statements
      • Our consultation responses
    • Codes
      • Back
      • Industry information
      • Codes
      • Code changes: Beginner's Guide
      • Connection and Use of System Code (CUSC)
      • Grid Code (GC)
      • System Operator Transmission Owner Code
      • Security and Quality of Supply Standard (SQSS)
      • Balancing Settlement Code (BSC)
      • Digitalised Whole System Technical Code (WSTC)
      • European Network Codes (ENC)
      • About the Codes Team
    • Industry Data and Reports
      • Back
      • Industry information
      • Industry Data and Reports
      • System Performance Reports
      • Balancing services performance monitoring report
      • Data finder and explorer
      • Forecast volumes and costs
      • System balancing reports
      • System constraints
      • Voltage costs
    • Winter Operations
      • Back
      • Industry information
      • Winter Operations
      • Markets Forum events
      • Operational Transparency Forum
    • Network Access Planning
      • Back
      • Industry information
      • Network Access Planning
      • What happens when there's an outage?
      • eNAMS
      • Accelerated Loss of Mains applications
  • Our strategy
    • Back
    • Home
    • Our strategy
    • Our RIIO-2 Business Plan
      • Back
      • Our strategy
      • Our RIIO-2 Business Plan
      • How we're performing under RIIO-2
      • RIIO-2 Stakeholder Group
      • Previous plans and documents
      • Get involved
    • Annual report and accounts
  • Research & publications
    • Back
    • Home
    • Research & publications
    • Future Energy Scenarios (FES)
    • Network Options Assessment (NOA)
    • ​Electricity Ten Year Statement (ETYS)
    • Markets Roadmap
    • Summer Outlook
    • Winter Outlook
    • Whole electricity system
    • System Operability Framework (SOF)
    • Regional Development Programmes
    • Balancing Market Review
National Grid ESO - Early competition project updates - Sunset

Record-breaking 2020 becomes greenest year for Britain’s electricity

  • Twitter
  • Facebook
  • LinkedIn
  • Email

11th January 2021 - Electricity explained

2020 was the greenest year on record for Britain’s electricity system, with average carbon intensity – the measure of CO2 emissions per unit of electricity consumed – reaching a new low.

According to our data, last year’s average carbon intensity was 181 gCO2/kWh – continuing a trend which has seen the system decarbonise by 66 per cent in the last seven years.

May 2020 saw both the greenest month on record (average carbon intensity 143 gCO2/kWh) and the lowest carbon intensity ever seen on the system – 46 gCO2/kWh on May 24.

These records underline the progress we're making towards our ambition of being able to operate the system carbon free by 2025

Significant periods of coal-free electricity generation and record-breaking levels of power from zero carbon sources were key factors in reducing 2020’s carbon intensity – while record low electricity demand during the nation’s lockdown also contributed.

During spring Britain saw its longest run since the industrial revolution generating electricity without using coal, stretching almost 68 days (1,630 hours) between April 10 and June 16.

National Grid ESO - winter report 2020 generation mix


In total the country was powered coal-free for over 5,147 hours in 2020, compared with 3,666 hours in 2019, 1,856 in 2018 and 624 in 2017. Coal generated only 1.6% of the electricity mix in 2020, compared with almost 25% five years ago.

Read our monthly insights in our regular electricity reports

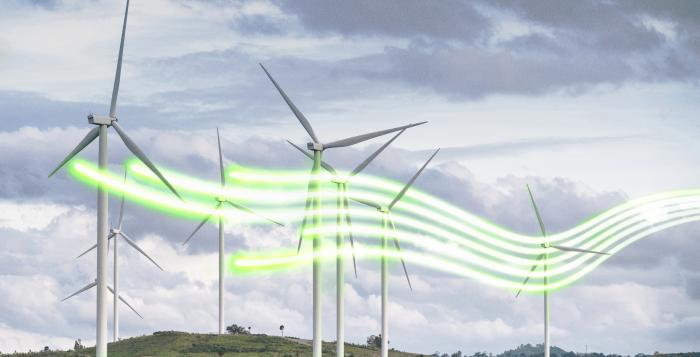
2020 was also a record-breaking year for renewable power sources.

The record for the highest ever level of wind generation was broken several times during the year – most recently on December 18 (17.2GW) – while August 26 saw wind contributing its highest ever share to the electricity mix (59.9%).

Solar power, too, set new records for its highest ever level of generation (9.7GW) and its highest share in the mix (34%) – comfortably providing a third of Britain’s electricity supplies on several occasions in May.

And while not everyone enjoyed a white Christmas, 2020 did bring a green Christmas – with the first ever coal-free Christmas day and zero carbon sources powering over half of our electricity demands.

National Grid ESO - primary keyword - windmill in field

2020 HIGHLIGHTS

• Dec 18 – highest ever level of wind power (17.2GW)
• Aug 26 – highest ever share of wind power (59.9%)
• May 30 – highest ever share of solar power (34%)
• May 24 – lowest ever carbon intensity (46 gCO2/kWh)
• May – greenest month on record (143 gCO2/kWh) 
• Apr 20 – highest ever level of solar power (9.7GW)
• Apr 10—Jun 16 – longest ever GB coal-free period 
• Total coal-free hours: 5,147 hours

2020 was also a year of firsts for Britain’s electricity system.

As part of National Grid ESO’s stability pathfinder initiative, Drax’s Cruachan hydroelectric pumped storage plant became the first to provide inertia to the grid in July without generating unnecessary electricity – a key milestone in managing a stable, zero carbon grid in the future.

In September, Tesla became the first user to go live with our new wider access API, marking a significant step in helping smaller power sources more easily access Britain’s balancing market.

And we rolled out the first in a suite of new fast-acting frequency products in October, boosting its control room’s ability to respond rapidly to disturbances in the flow of energy around the grid.


National Grid ESO - winter report 2020 pick ups
 
Rob Rome, interim head of national control at National Grid ESO, said:

“2020 has been a record-breaking year for Great Britain’s electricity system. The grid continues to transform at an astonishing rate as we move away from fossil fuel generation and harness the growth of renewable power sources.

“In our role balancing Britain’s electricity supply and demand, we’re continuously innovating with industry to improve the grid’s resilience and make sure it’s ready to exploit the potential of these renewables.

“It’s an exciting time, and the progress we’re seeing with these records underlines the significant strides we’re taking towards our ambition of being able to operate the system carbon free by 2025.

“That 2025 ambition is a stretching target. Last year gave us a flavour of some of the challenges ahead, as our control room worked 24/7 to operate the electricity system in unprecedented conditions.

“But I’m proud to say every action we’ve taken has delivered safe, secure and reliable low carbon electricity at the same time as minimising costs for consumers.”

Follow Britain's electricity mix live through our carbon intensity app.

Similar reading

Wind turbines over sunset ESO : Electricity explained

Britain's Electricity Explained: 2022 Review

6 January 2023

With another year over, the ESO looks back at how electricity was generated and used across 2022, and some of the notable events seen through the year. We’ve seen a number of records broken across the year as various conditions aligned to deliver new firsts in wind generation and total zero carbon generation.

Read article
Control room balancing the grid ESO : Electricity explained

Platinum Jubilee – How has electricity changed during the Queen's reign?

31 May 2022

As the Queen marks her Platinum Jubilee, we look back at how electricity - how it is used and generated - has changed during her reign.

Read article
ESO : Electricity explained

Easter Monday sees record low carbon intensity for GB electricity

6 April 2021

Great Britain’s electricity grid was the greenest it’s ever been at 1pm on Monday 5th April.

Read article
National Grid ESO
© National Grid 2023

Connect with us

  • Twitter
  • LinkedIn
  • Youtube
  • Instagram
  • Contact us
    • Media centre
    • Work for us
  • Information
    • Privacy policy
    • Cookie policy
    • Terms and conditions
    • Security
    • Modern Slavery Statement
© National Grid 2023
Top