

Our year-round system needs
The ETYS is the ESO’s view of how the future transmission system requirements will be met. Currently, this focuses mainly on bulk power transfer requirements, particularly during winter-peak conditions.
As operation of the National Electricity Transmission System (NETS) becomes increasingly complex, we need to expand our view of system needs across the year, to consider a wider range of network conditions. This will require the use of innovative analysis techniques and the development of new tools.
As part of the ongoing Network Planning Review, we are exploring how we can further enhance our communication of system needs in ETYS. We would like to hear your views on how we can improve the ETYS in this regard and we have set up a short survey to gather feedback.
Take our improving ETYS survey
Why year-round system needs?
We have continued to develop our year-round thermal tool, POUYA (Power Uncertainty Year-round Analyser). It allows us to capture the power transfer limitations on the GB NETS, not only during the winter, but also across the other seasons of the year. It's driven by the seasonal characteristics of generation, demand, and considering circuit ratings appropriate for the different seasons.
Expanding our view of system needs both across an entire year and at a circuit level will become increasingly important as our generation and demand mix changes to meet our net zero targets.
Further work is ongoing to analyse future years, and we expect to gain further insights of specific limitations across different years. This will allow us to identify and communicate targeted system needs, and enable us to further understand where system needs are driven by credible scenarios that we have not considered previously, due to our single snap-shot analysis.
We continue see the communication of year-round needs as serving the following purposes:
- Providing insight to our stakeholders into limitations or network needs across other seasons.
- Identifying additional scenarios that should be considered for detailed analysis.
- Identifying opportunities for targeted network or commercial solutions.

Where are we now?
Building on the examples of year-round analysis that we shared in ETYS 2022, this year we have prepared analysis for a range of network boundaries across the NETS. Our analysis has been performed using generation, demand, and network backgrounds from the Year 2 ETYS 2023 model (representative of the 2024/25 period).
Using our year-round analysis tool, we have analysed the generation and demand dispatches from our economic tool (BID3). BID3 produces credible generation and demand snapshots representing 3-hour blocks, across the year, to produce 2920 individual snapshots for POUYA to analyse. These align with the dispatches used in our existing network planning process which drive investment decisions, however these are clustered for our POUYA analysis.
We have analysed key boundaries B4, B6, B7a and LE1 which provide us a good range across all the three Transmission Owners while testing the unique limitations associated with different regions.
System needs – boundary transfers
Boundary B4 is a key boundary separating the SP Transmission and SSEN Transmission networks, running from the Firth of Tay in the east to the north of the Isle of Arran in the west.
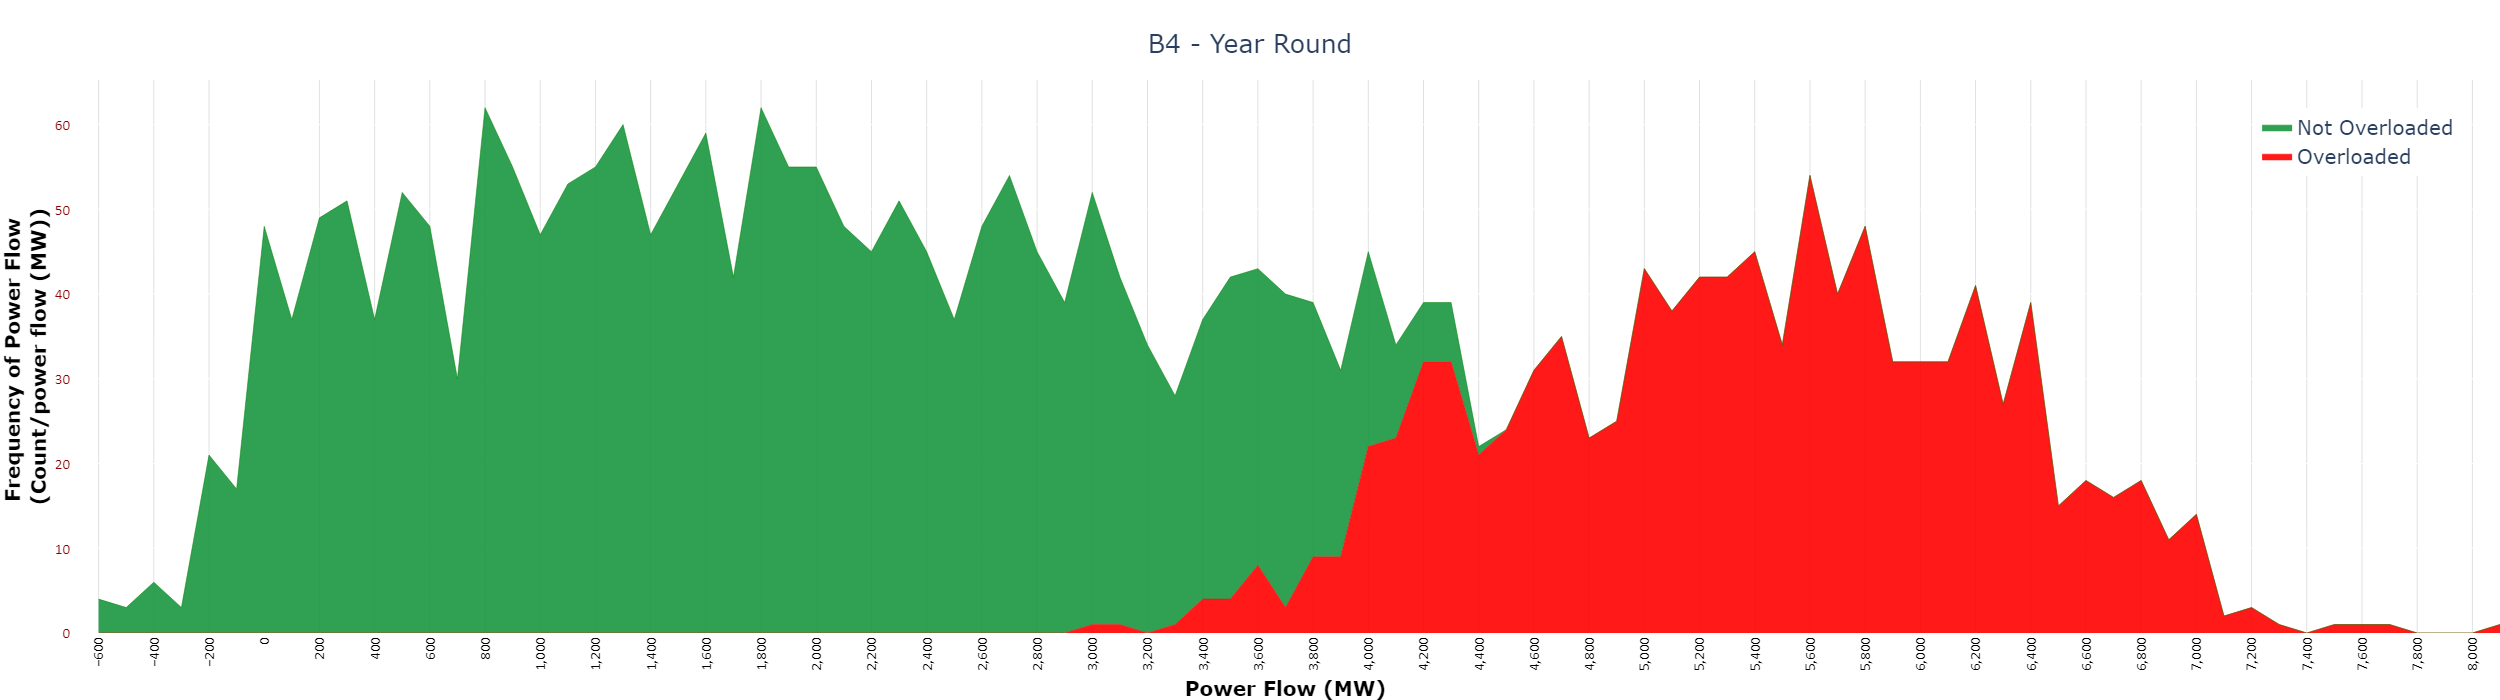
For our analysis this year, we have assessed the year-round dispatches from our economic tool BID3. POUYA analyses every snapshot and identifies whether any assets are overloaded (in base case or following contingencies) and we tag each boundary transfer snapshot as either ‘overloaded’ or ‘not overloaded.'
Download a larger version of the image
In ETYS 2022, the year 1 winter-peak boundary capability for B4 was identified as 3.4GW. As shown in the above chart, the overloaded and not overloaded outcomes may overlap at a given boundary flow. This indicates that there are other scenarios resulting in the same flow across the boundary, but the generation and demand is such that it results in overloads. A more detailed look at the nature of these overloads allows us to understand if it is a limitation that we have encountered in our winter peak analysis.
Download a larger version of the image
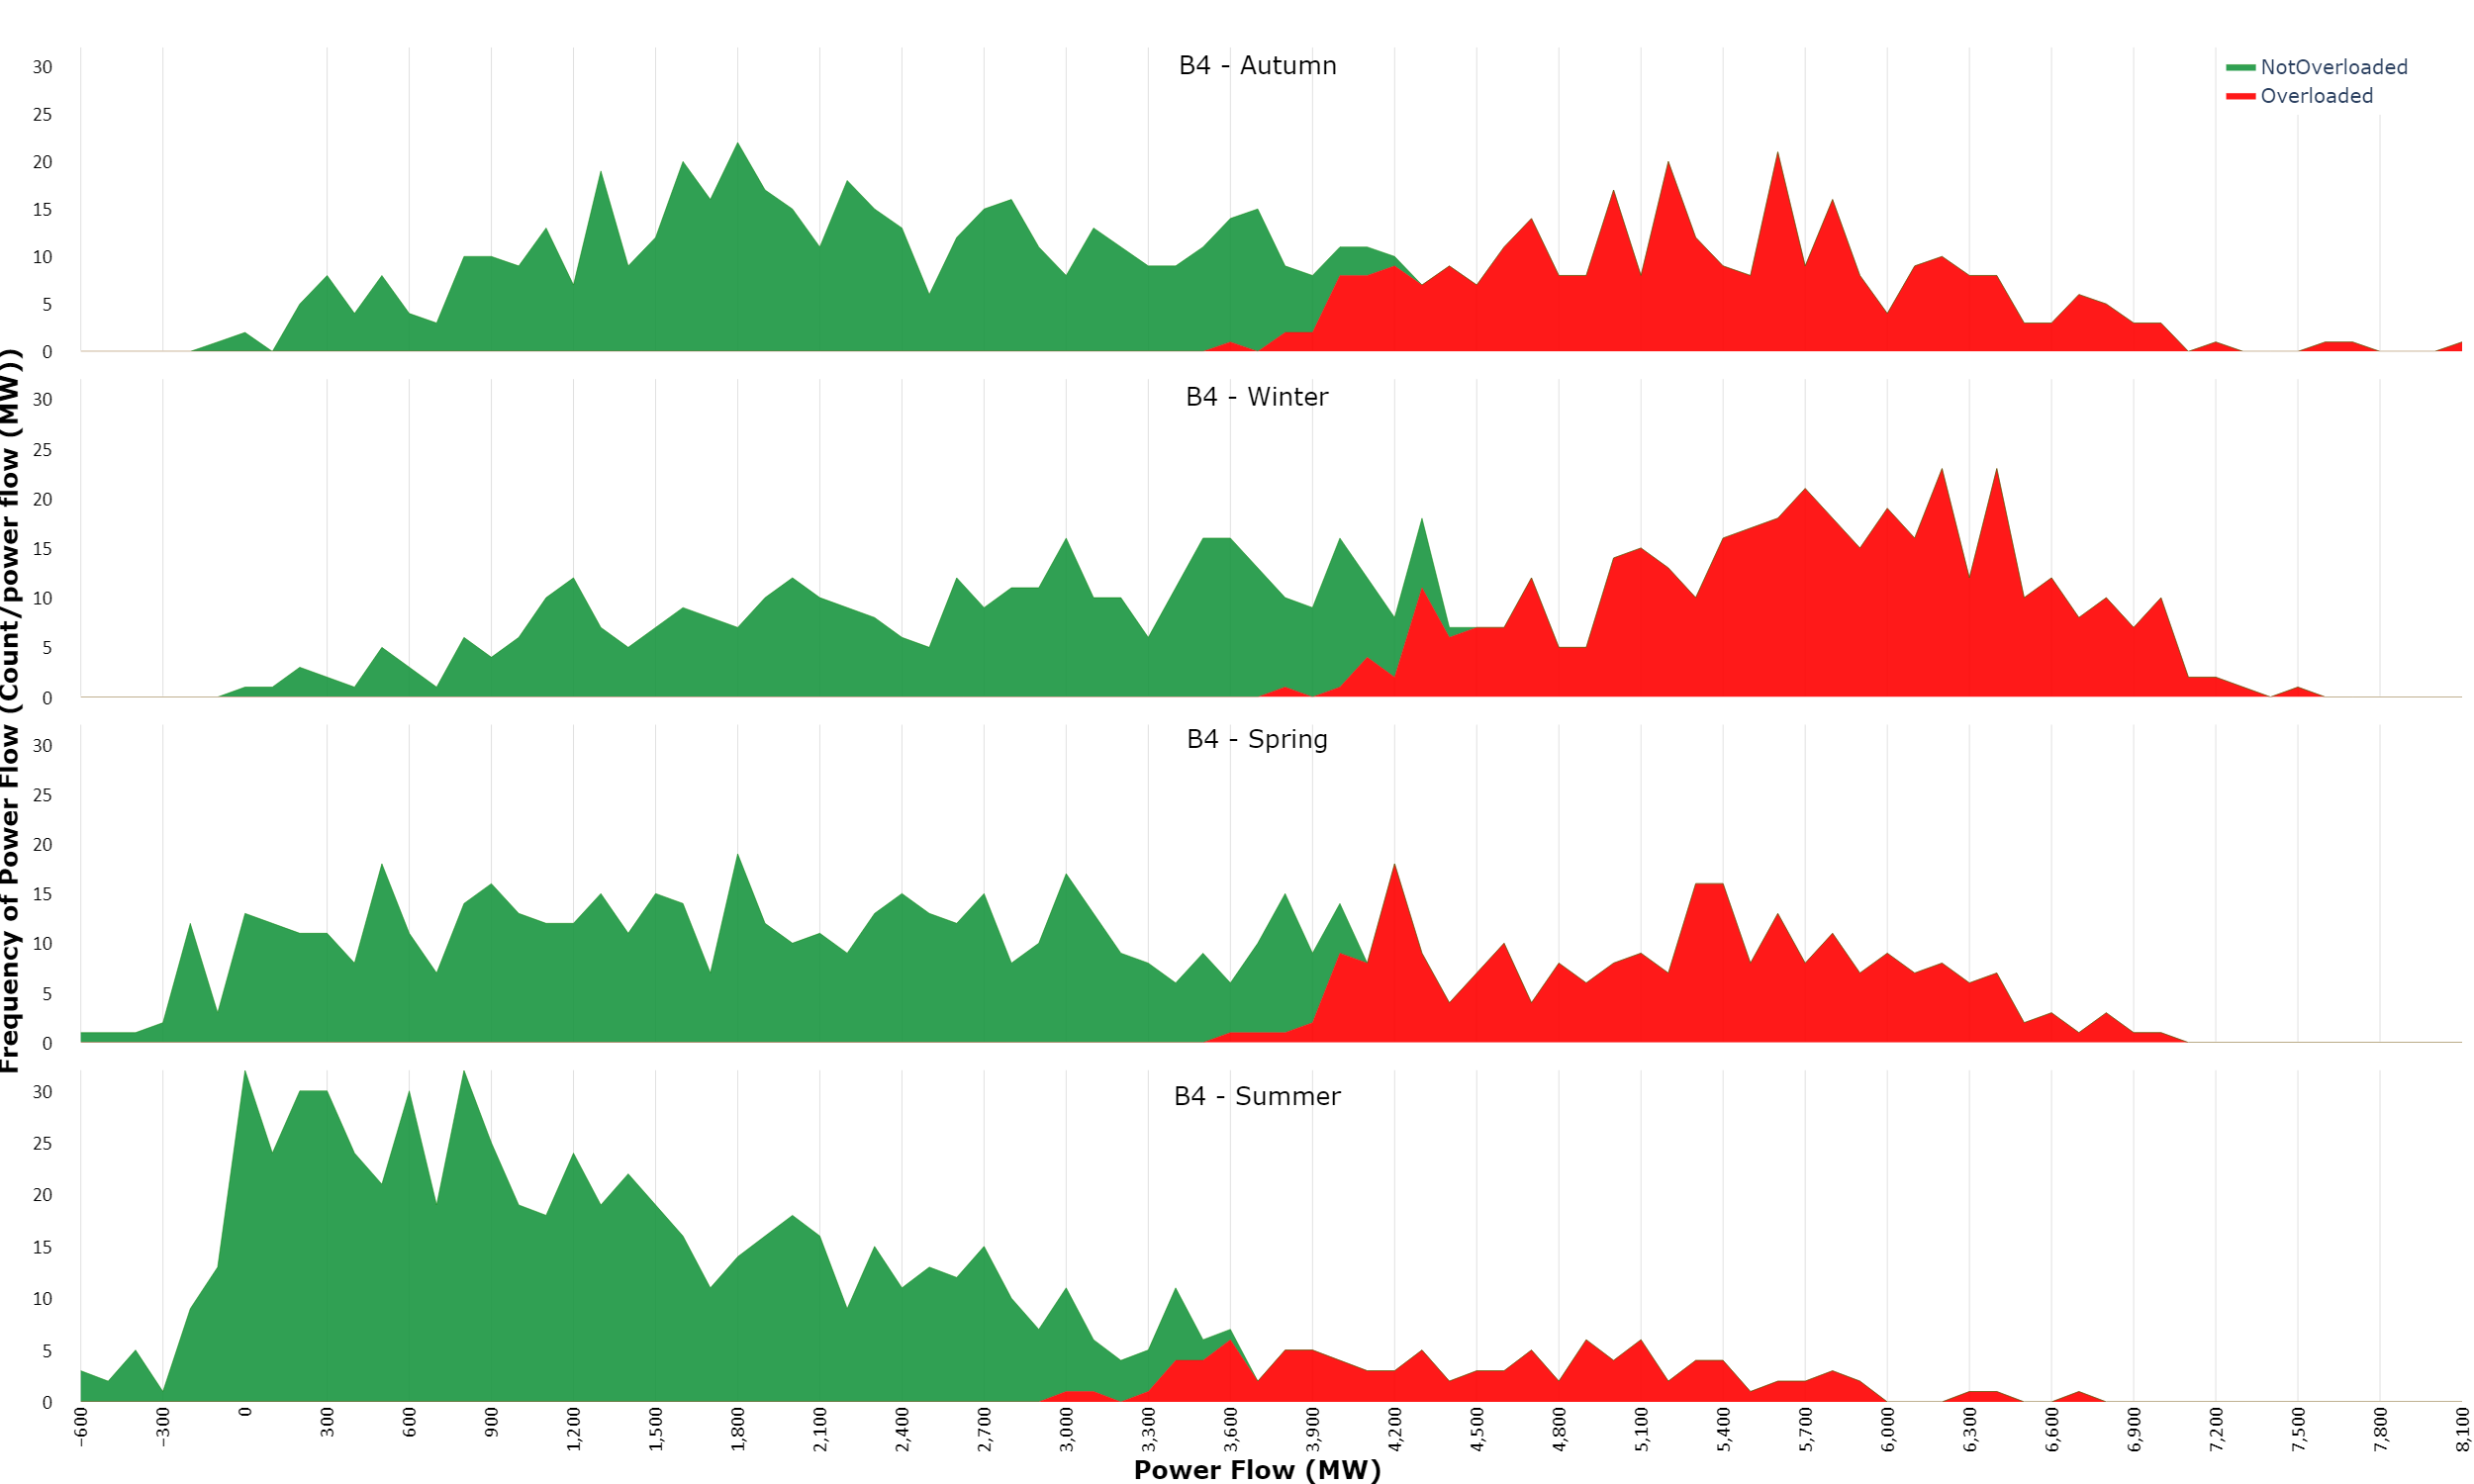
In the separate seasonal charts we can analyse the differences across seasons. In summer, overloads are seen for power flows above 2900MW but not frequently. Overloads in the summer occur at lower power flows compared to the other seasons due to the lower ratings applied in the summer season.
For winter, overloads are seen for power flows from around 3700MW with most occurrences of ‘overloaded’ snapshots, occurring in winter closely followed by autumn.
System needs – constrained assets
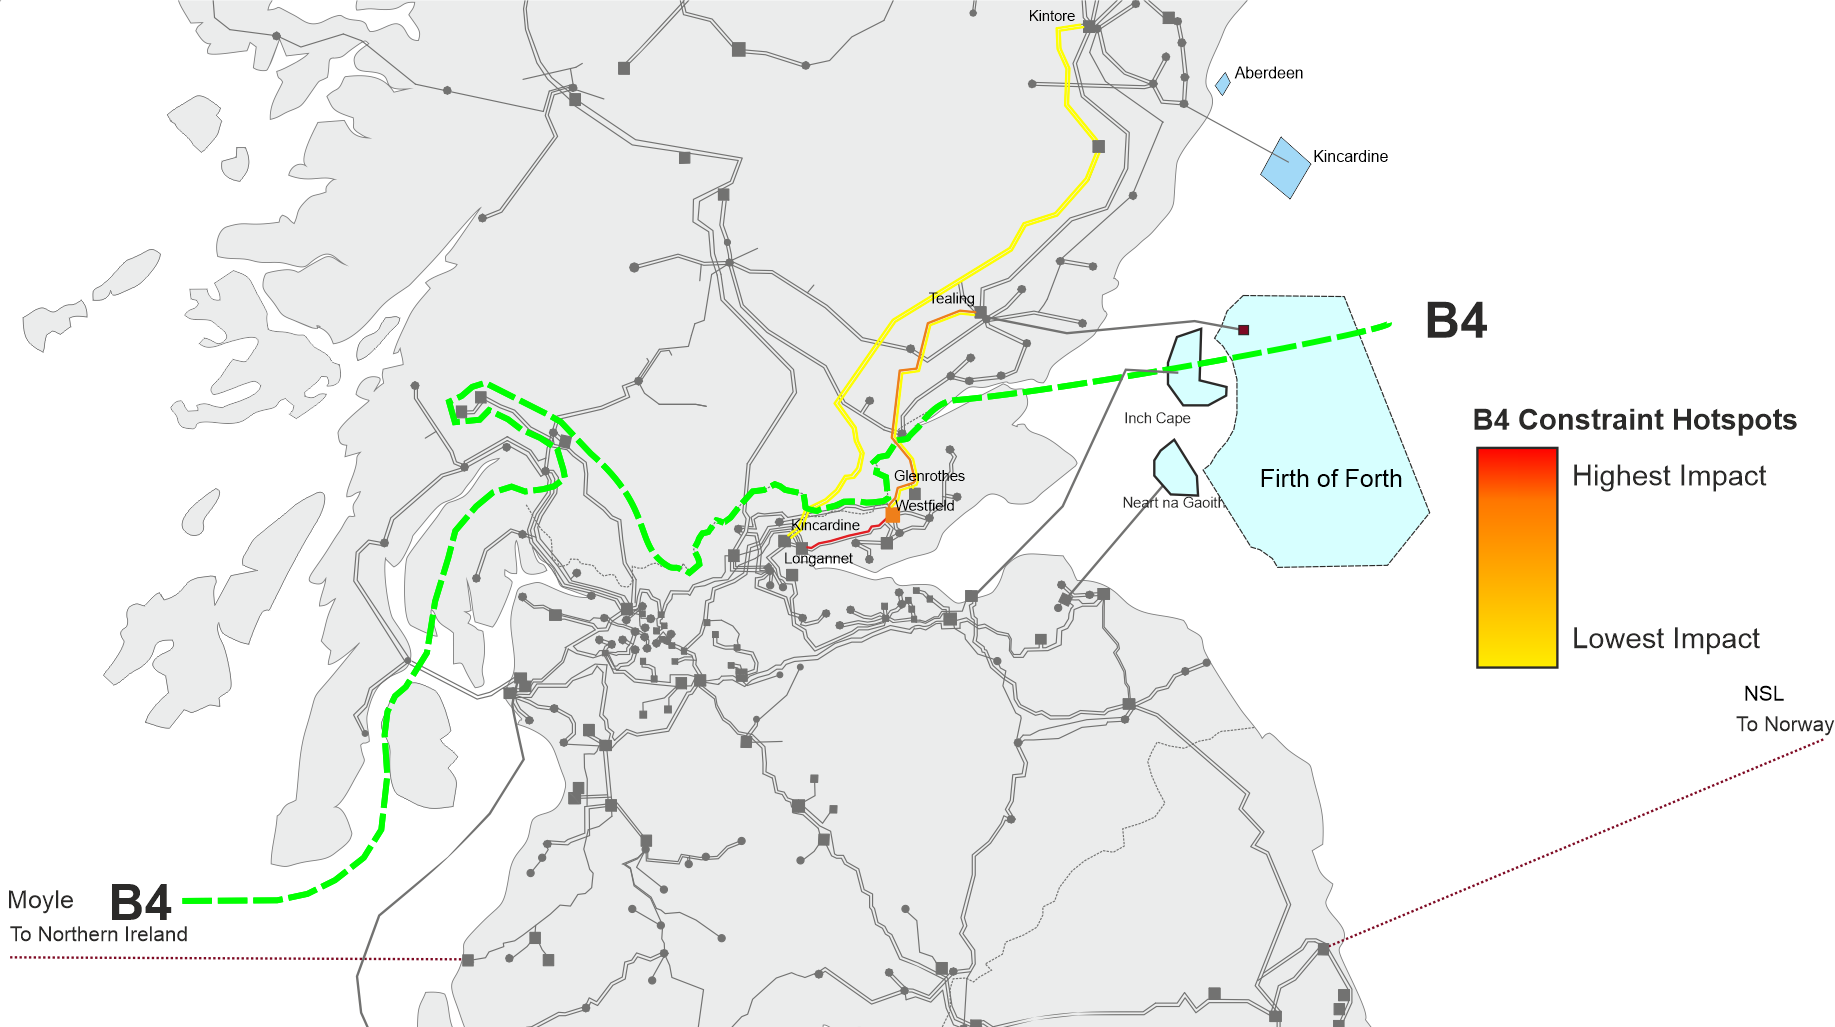
The map below shows a geographical representation of the transmission assets which experienced overloading across all seasons for the B4 contingencies. We indicate the constraint hotspots using a heatmap key, with the impact of the constraint representing a measure of the likelihood and severity of the overloading on that asset.
Download a larger version of the image
The most prominent constraint identified for the B4 boundary was the Longannet–Westfield 275kV circuit, followed by the Tealing–Westfield and Alyth–Kincardine 275kV circuits. Most constraints identified across B4 were on the eastern side of the network, along or close to the Kincardine–Fetteresso and Longannet–Westfield–Tealing routes.
In the year 1 boundary studies conducted for ETYS 2022, the limiting asset was also identified as the Longannet–Westfield 275kV circuit. Planned reinforcements to support this boundary include various offshore links connecting Scotland and Northern England, which will allow power flows to bypass and reduce the loading across the onshore network in this area.
The East Coast Onshore 400kV Phase 2 NOA reinforcement (TKUP) (expected in 2030) will establish new 400kV infrastructure on the east coast of Scotland, providing additional capacity to the eastern corridor across the B4 boundary. This will reduce the severity of loading on assets along the Tealing – Westfield – Glenrothes route and enhance the boundary transfer capability of B4.
View an interactive version of the graph
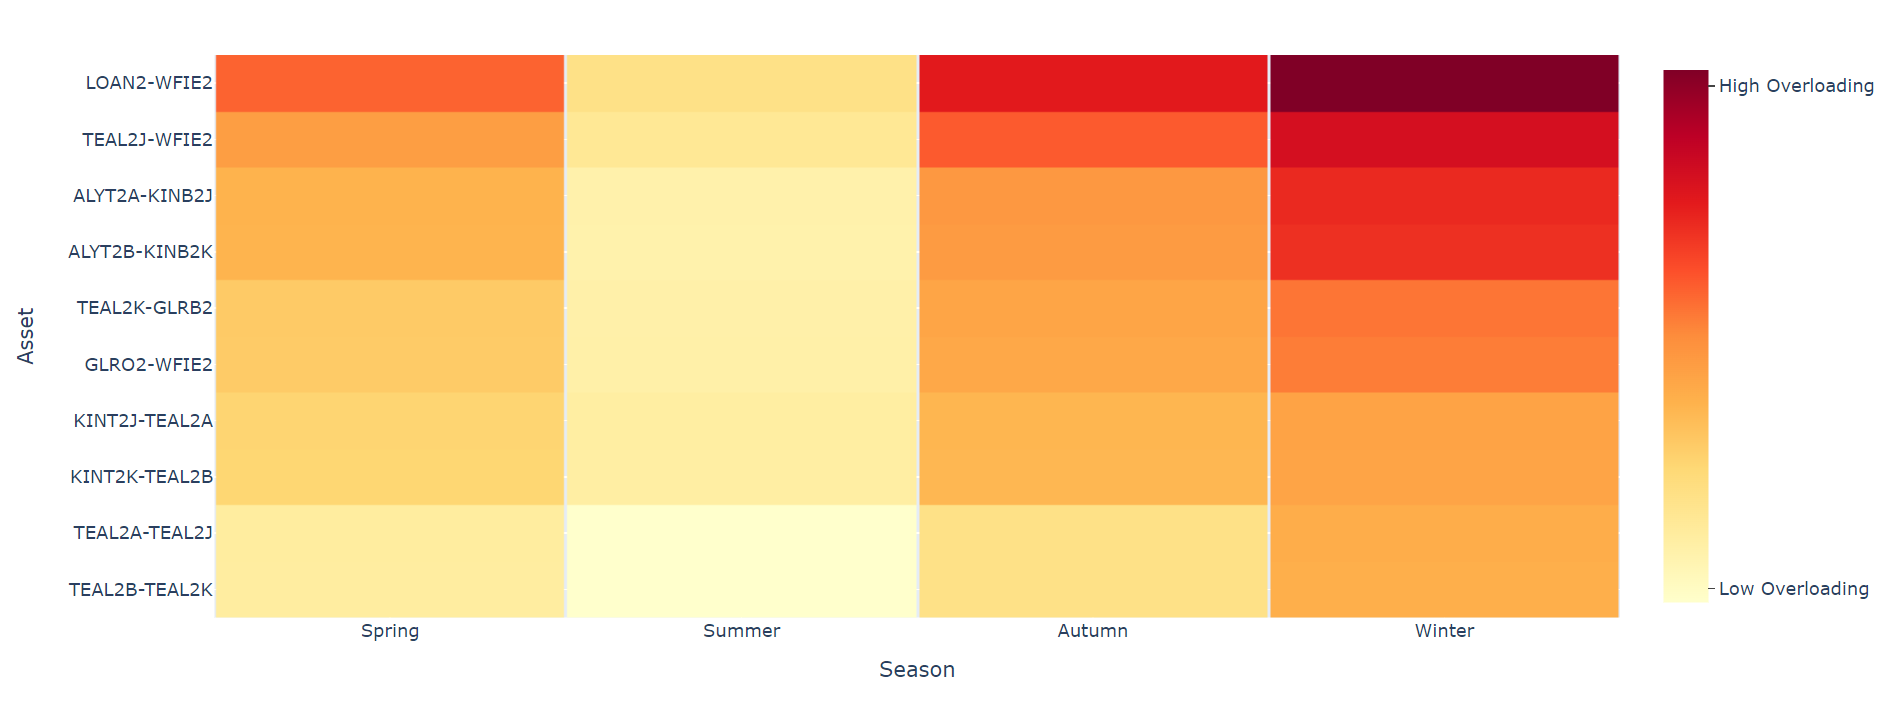
All assets associated with B4 follow a general trend of experiencing the most overloading in winter, compared with the other seasons.
The 400/275kV supergrid transformer (SGT) at Denny was also identified as one of the most prominently overloaded assets originally, applying the short-term (6-hour) thermal rating to this asset (as is done in our traditional boundary studies) reduced the frequency and severity of these overloads. Following this, some overloads were still present when flows along the Melgarve – Denny 400kV circuit were high. The Denny North 400/275kV second SGT (DNEU) NOA reinforcement will add a new SGT at Denny 400kV, slated for delivery in 2026 according to the NOA 21/22 Refresh, which should alleviate remaining constraints across the existing Denny SGT.
As the ESO enters the next phase of our network planning cycle with the Transmission Owners and other interested parties (the TCSNP2), we will assess the need for network reinforcement or non-build solutions within the region and GB-wide.
System needs – boundary transfers
Boundary B6 is a key boundary separating the SP Transmission and National Grid transmission networks, running roughly along the border between Scotland and England.
Download a larger version of the image
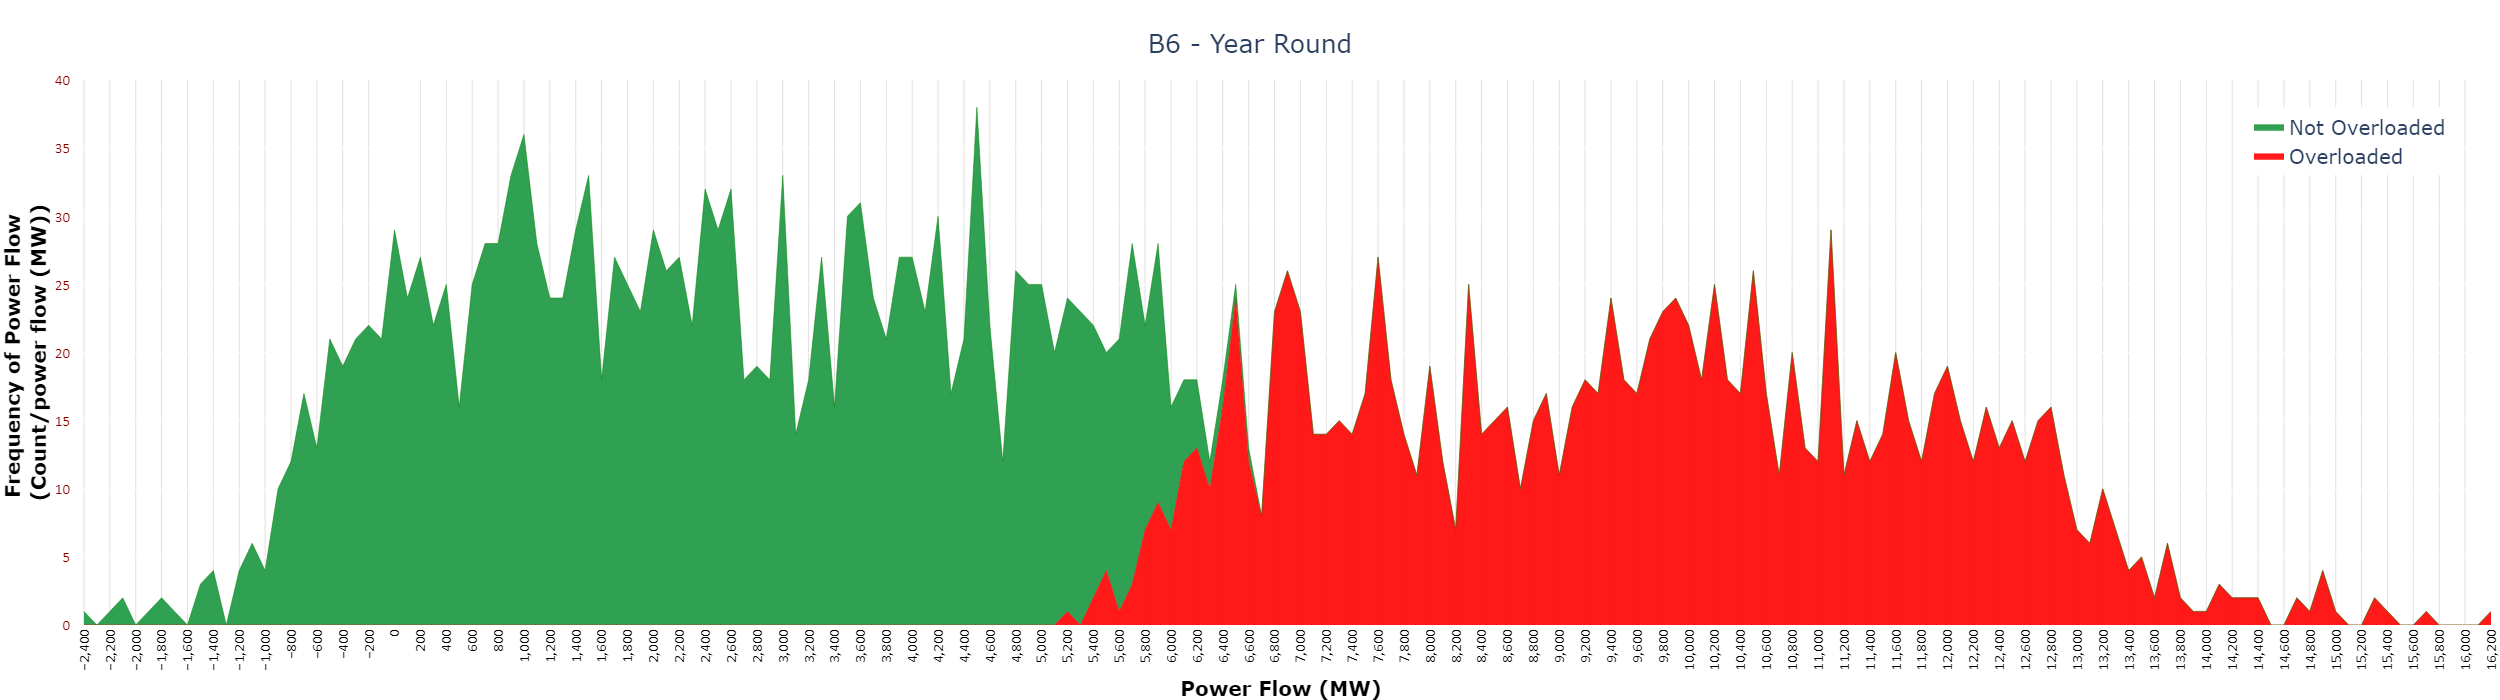
In ETYS 2022, the year 1 winter-peak boundary capability for B6 was identified as 6.3GW. Although most overloads are identified in winter, autumn and spring also have similar frequency of overloads, with the least overloads in summer.
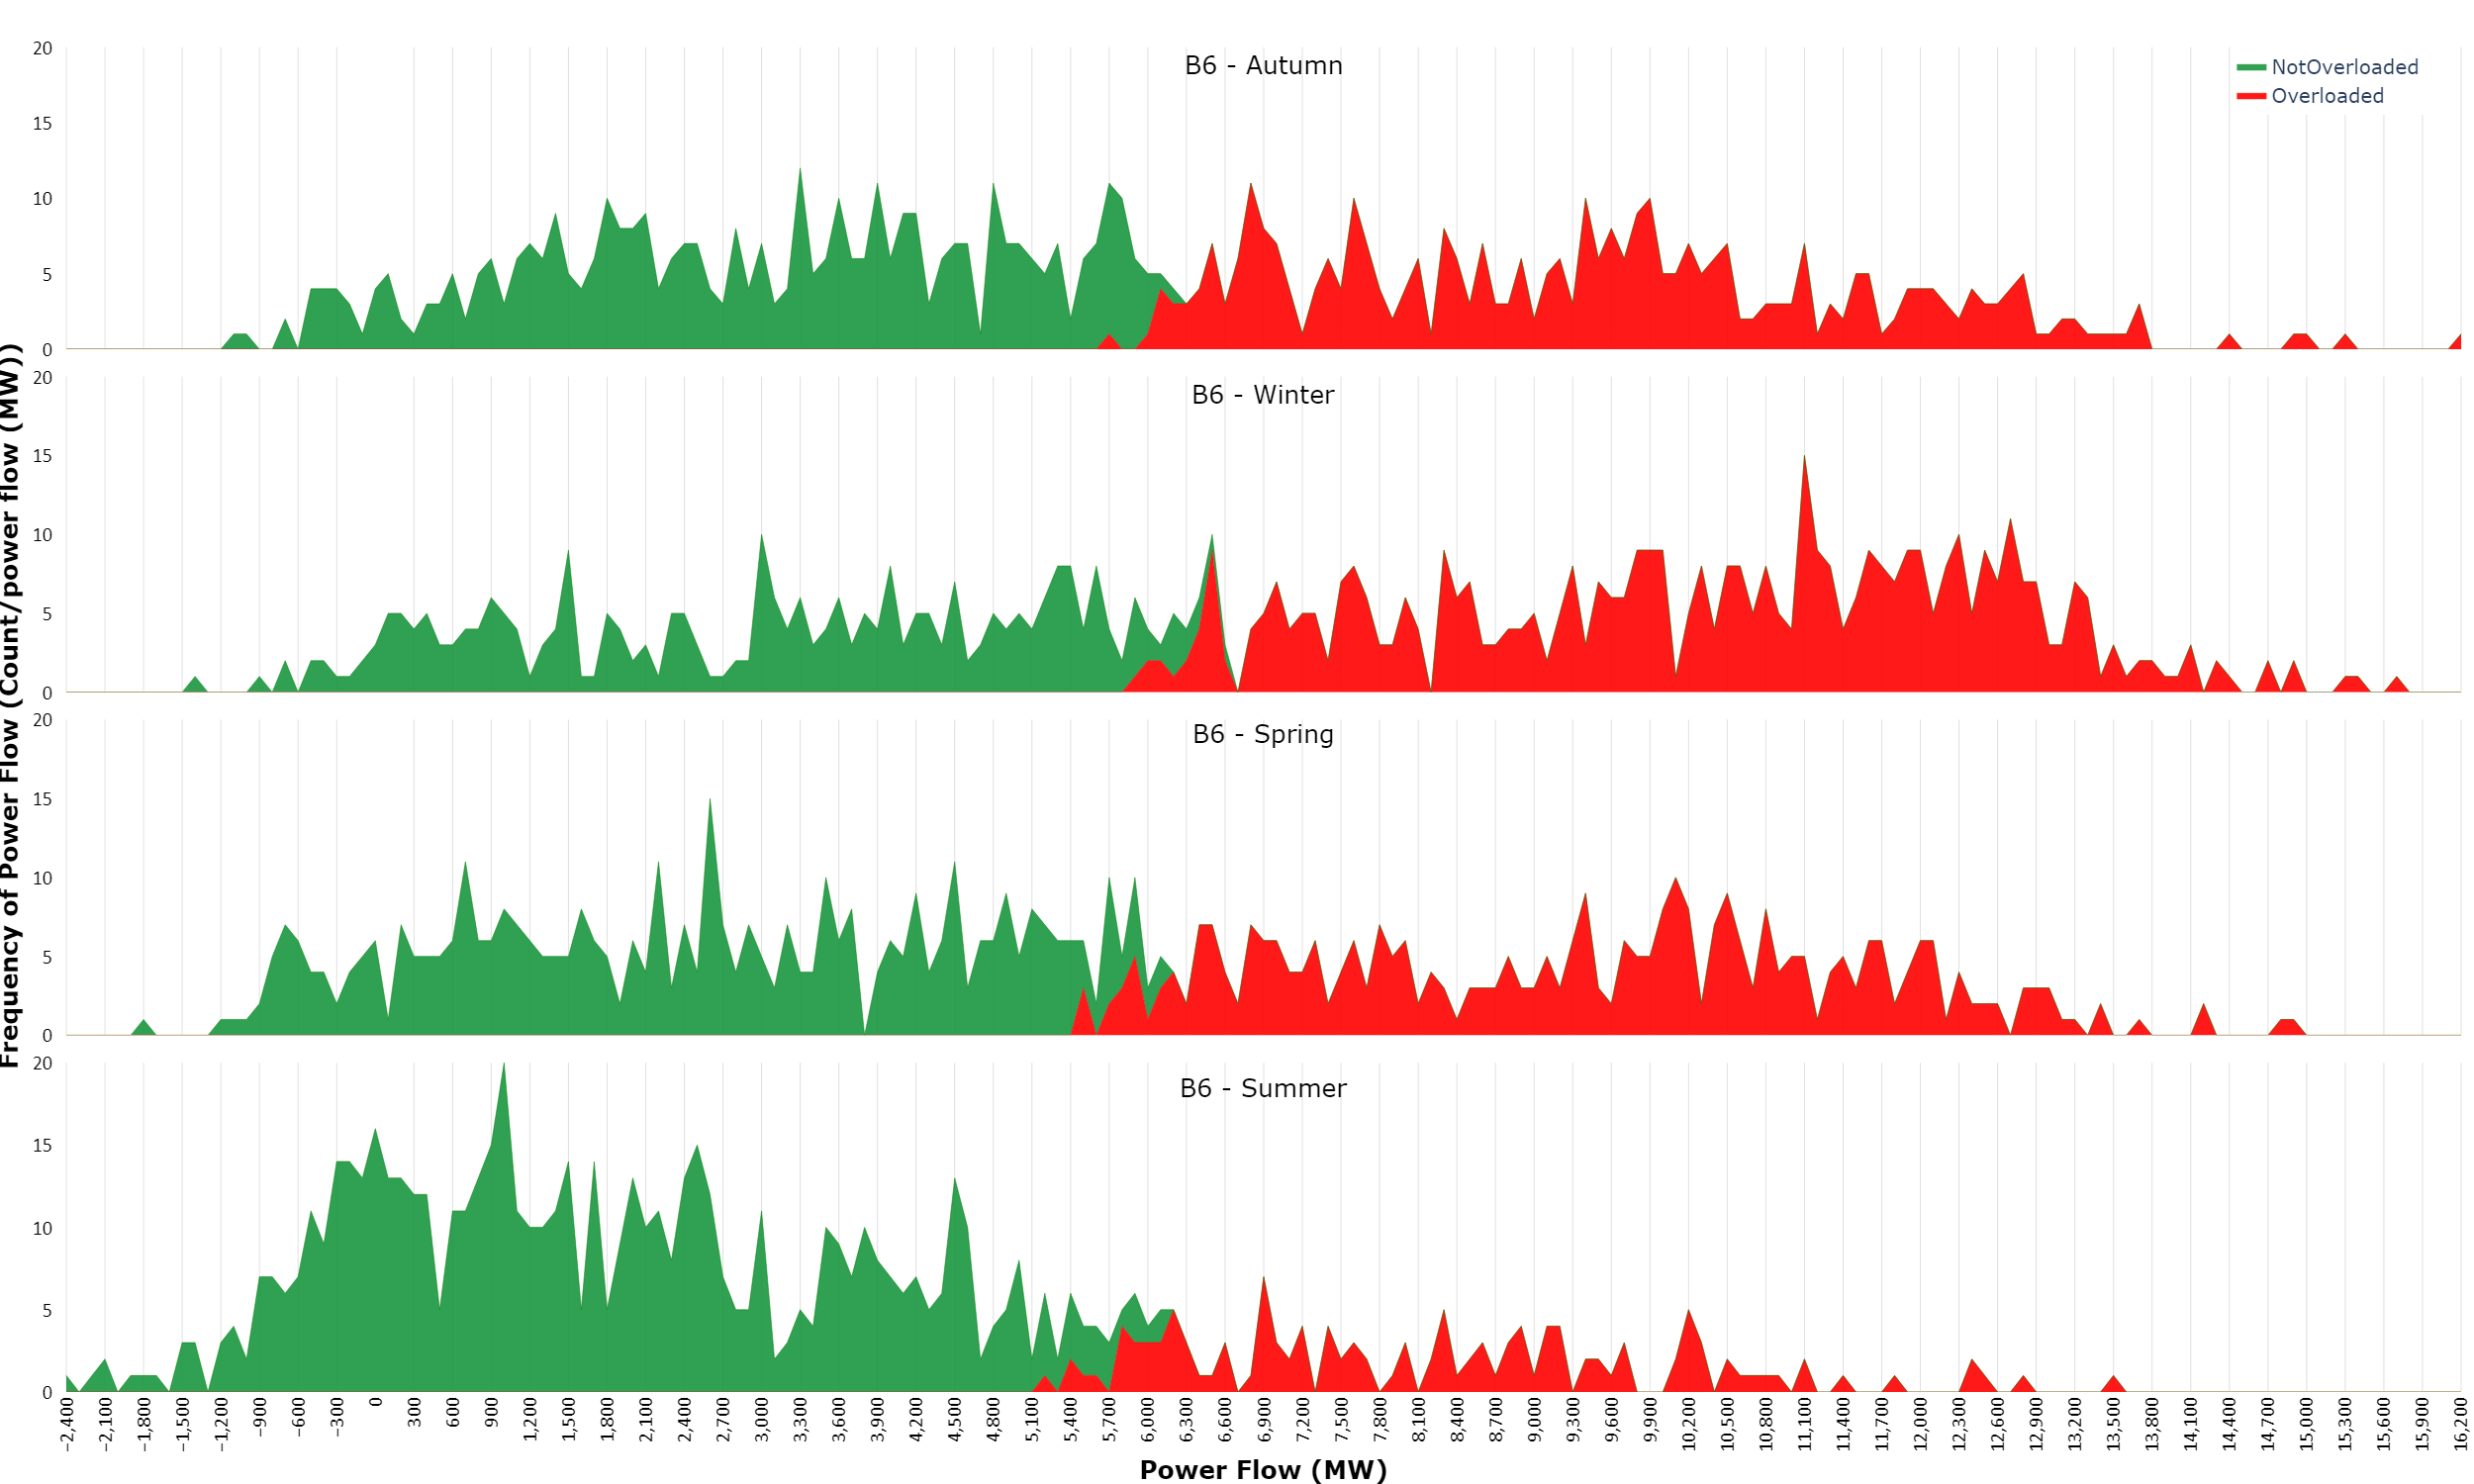
Download a larger version of the image
Overloads are seen for power flows above 5100MW in summer and around 5800MW in winter. Most overloads are seen in winter and autumn, followed by spring and summer.
System needs – constrained assets
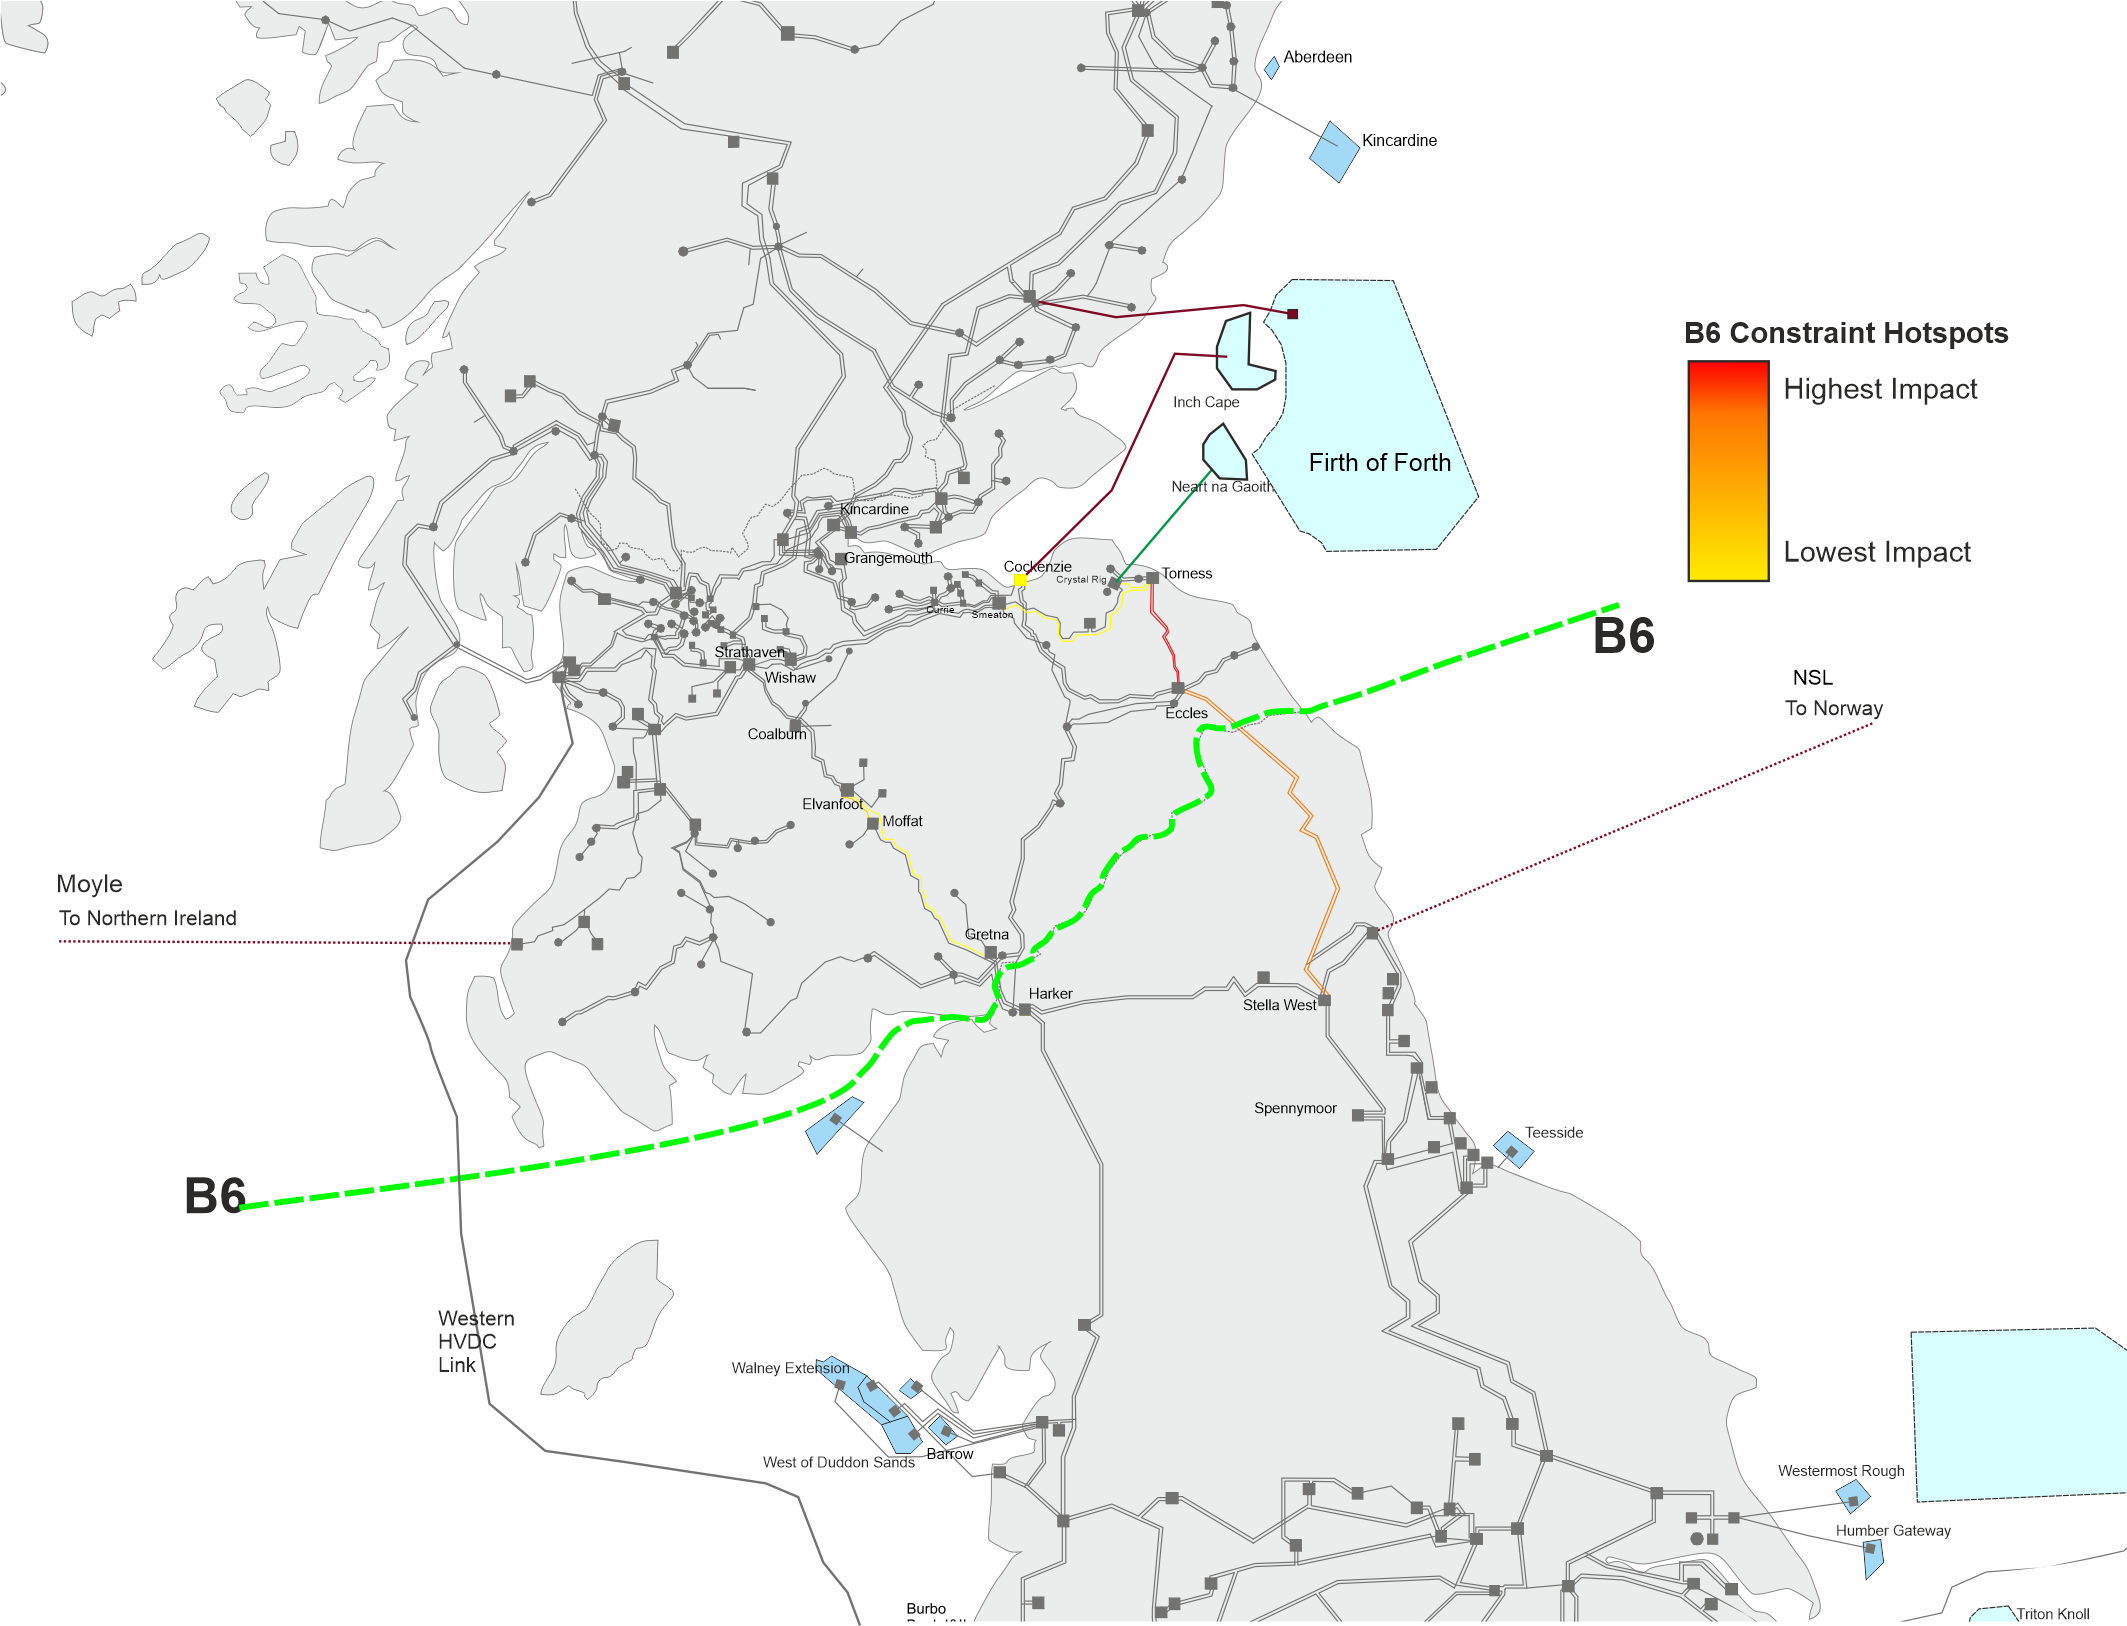
The map below shows a geographical representation of the transmission assets which experienced overloading across all seasons for the B6 contingencies.
Download a larger version of the image
The most prominently overloaded assets identified across the B6 boundary were the Eccles–Torness and Eccles–Stella West 400kV circuits, forming the main eastern corridor which crosses B6. This was followed by the Elvanfoot–Moffat and Elvanfoot– Gretna 400kV circuits (part of the main western corridor across B6), and the circuits between Smeaton–Crystal Rig–Torness.
In the year-round analysis published in ETYS 2022, SGT5 at Harker 400kV was identified as the most overloaded asset. Following NOA reinforcement HAEU which saw HAE2 replace SGT6 and the banking of SGT5 and SGT9A, the overloading occurrences seen across the SGTs at Harker 400kV has been greatly reduced.
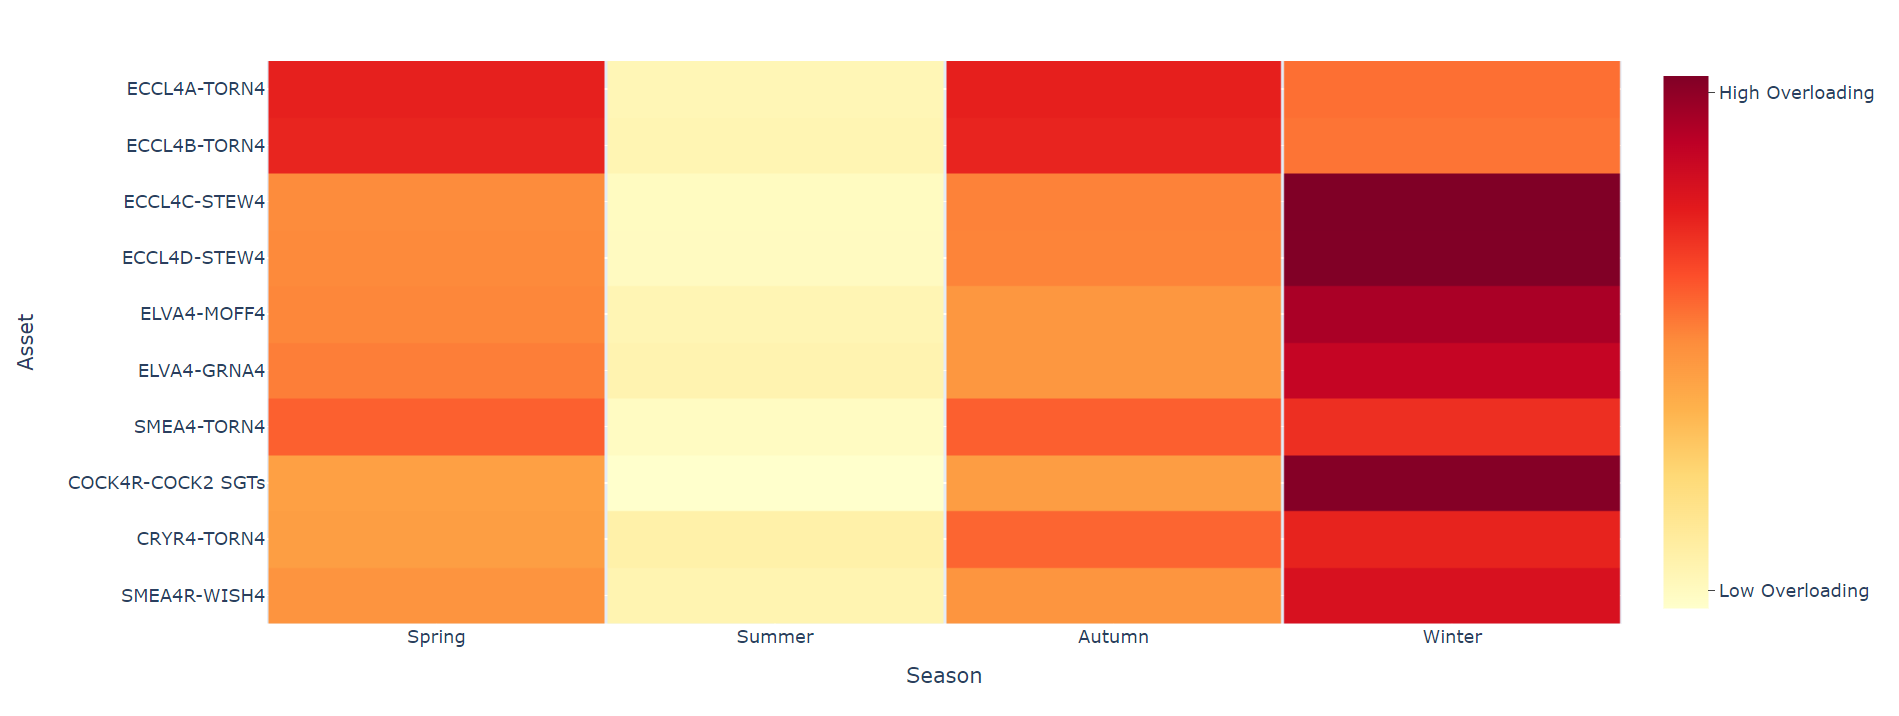
View an interactive version of the graph
Generally, across the different seasons we see the most overloading occurrences in winter, but for the Eccles–Torness 400kV circuit, POUYA has identified that we might observe slightly more frequent and severe overloading during the spring and autumn periods. The thermal rating of this circuit in winter is 2330MVA, falling to 1880MVA in spring/autumn. As seen in the chart above, a similar spread of boundary flow can be seen during spring/autumn as in winter.
As the ESO enters the next phase of our network planning cycle with the Transmission Owners and other interested parties (the TCSNP2), we will assess the need for network reinforcement or non-build solutions within the region and GB-wide.
System needs – boundary transfers
Boundary B7a bisects England south of Teesside and into the Mersey Ring area. It captures network restrictions on circuits feeding down through Liverpool, Manchester, and Leeds.
Download a larger version of the image
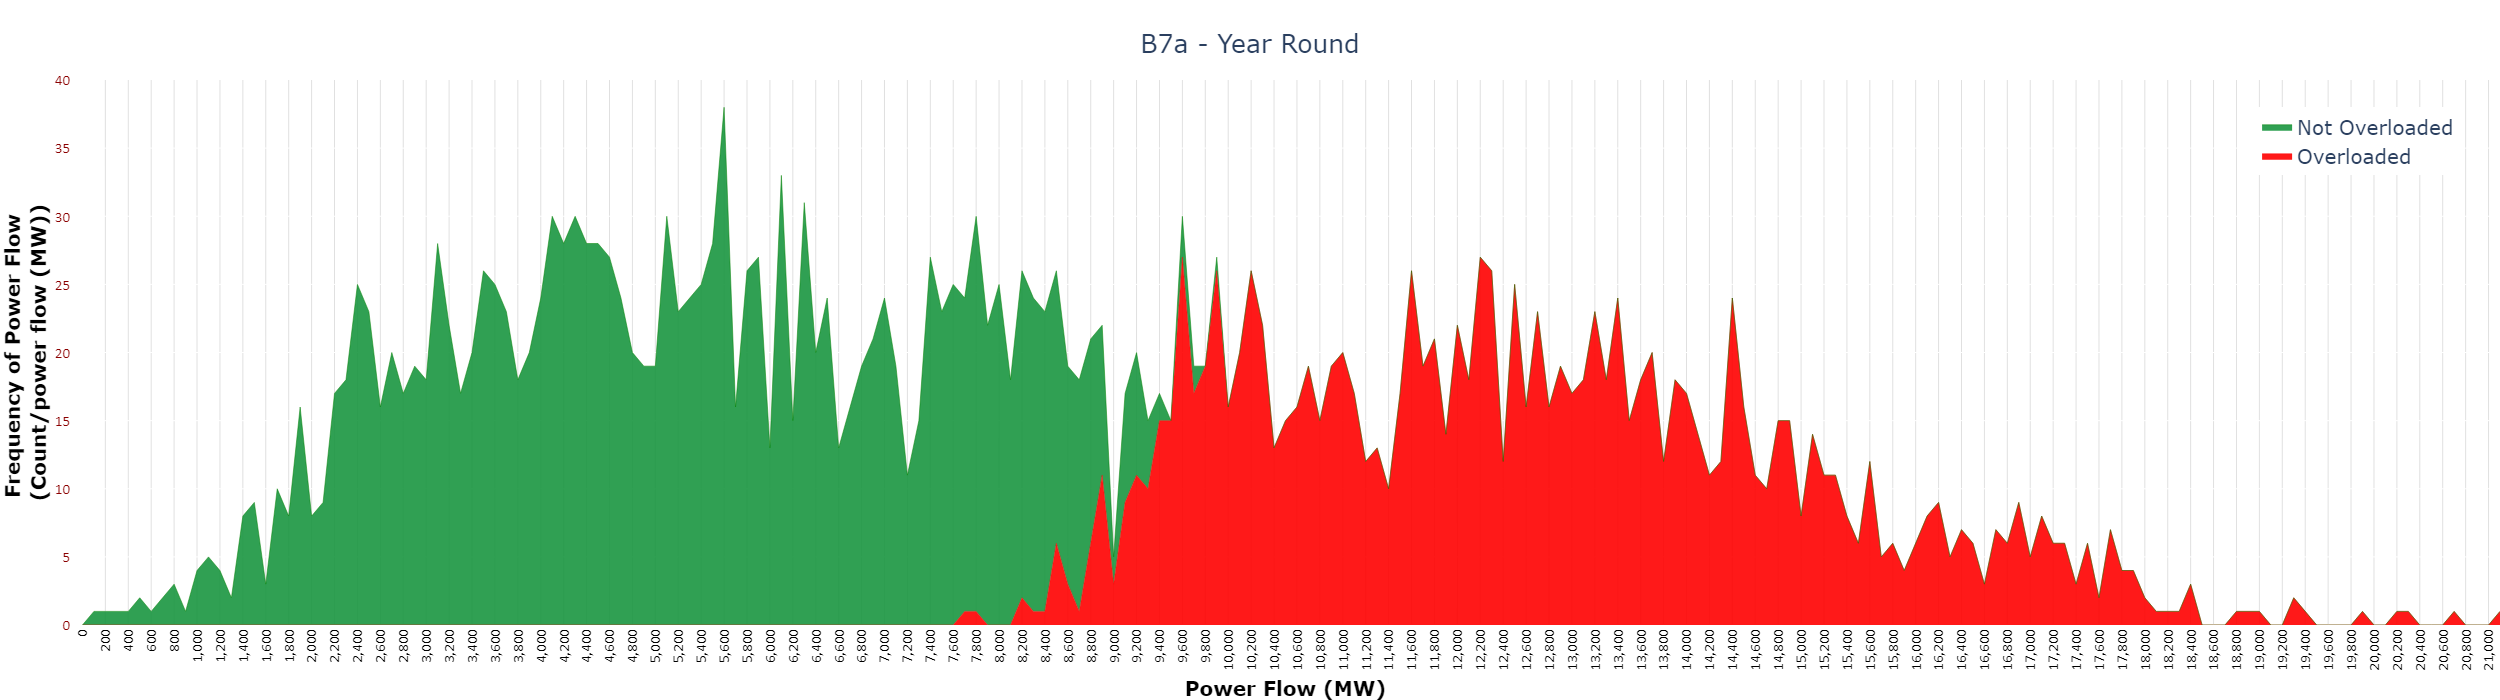
In ETYS 2022, the year 1 winter-peak boundary capability for B7a was identified as 9.4GW. As shown in the above chart, the overloaded and not overloaded outcomes may overlap. Acceptable boundary transfers may occur at flows higher than the single snapshot winter-peak boundary capability, due to the wider range of network snapshots and conditions being analysed.
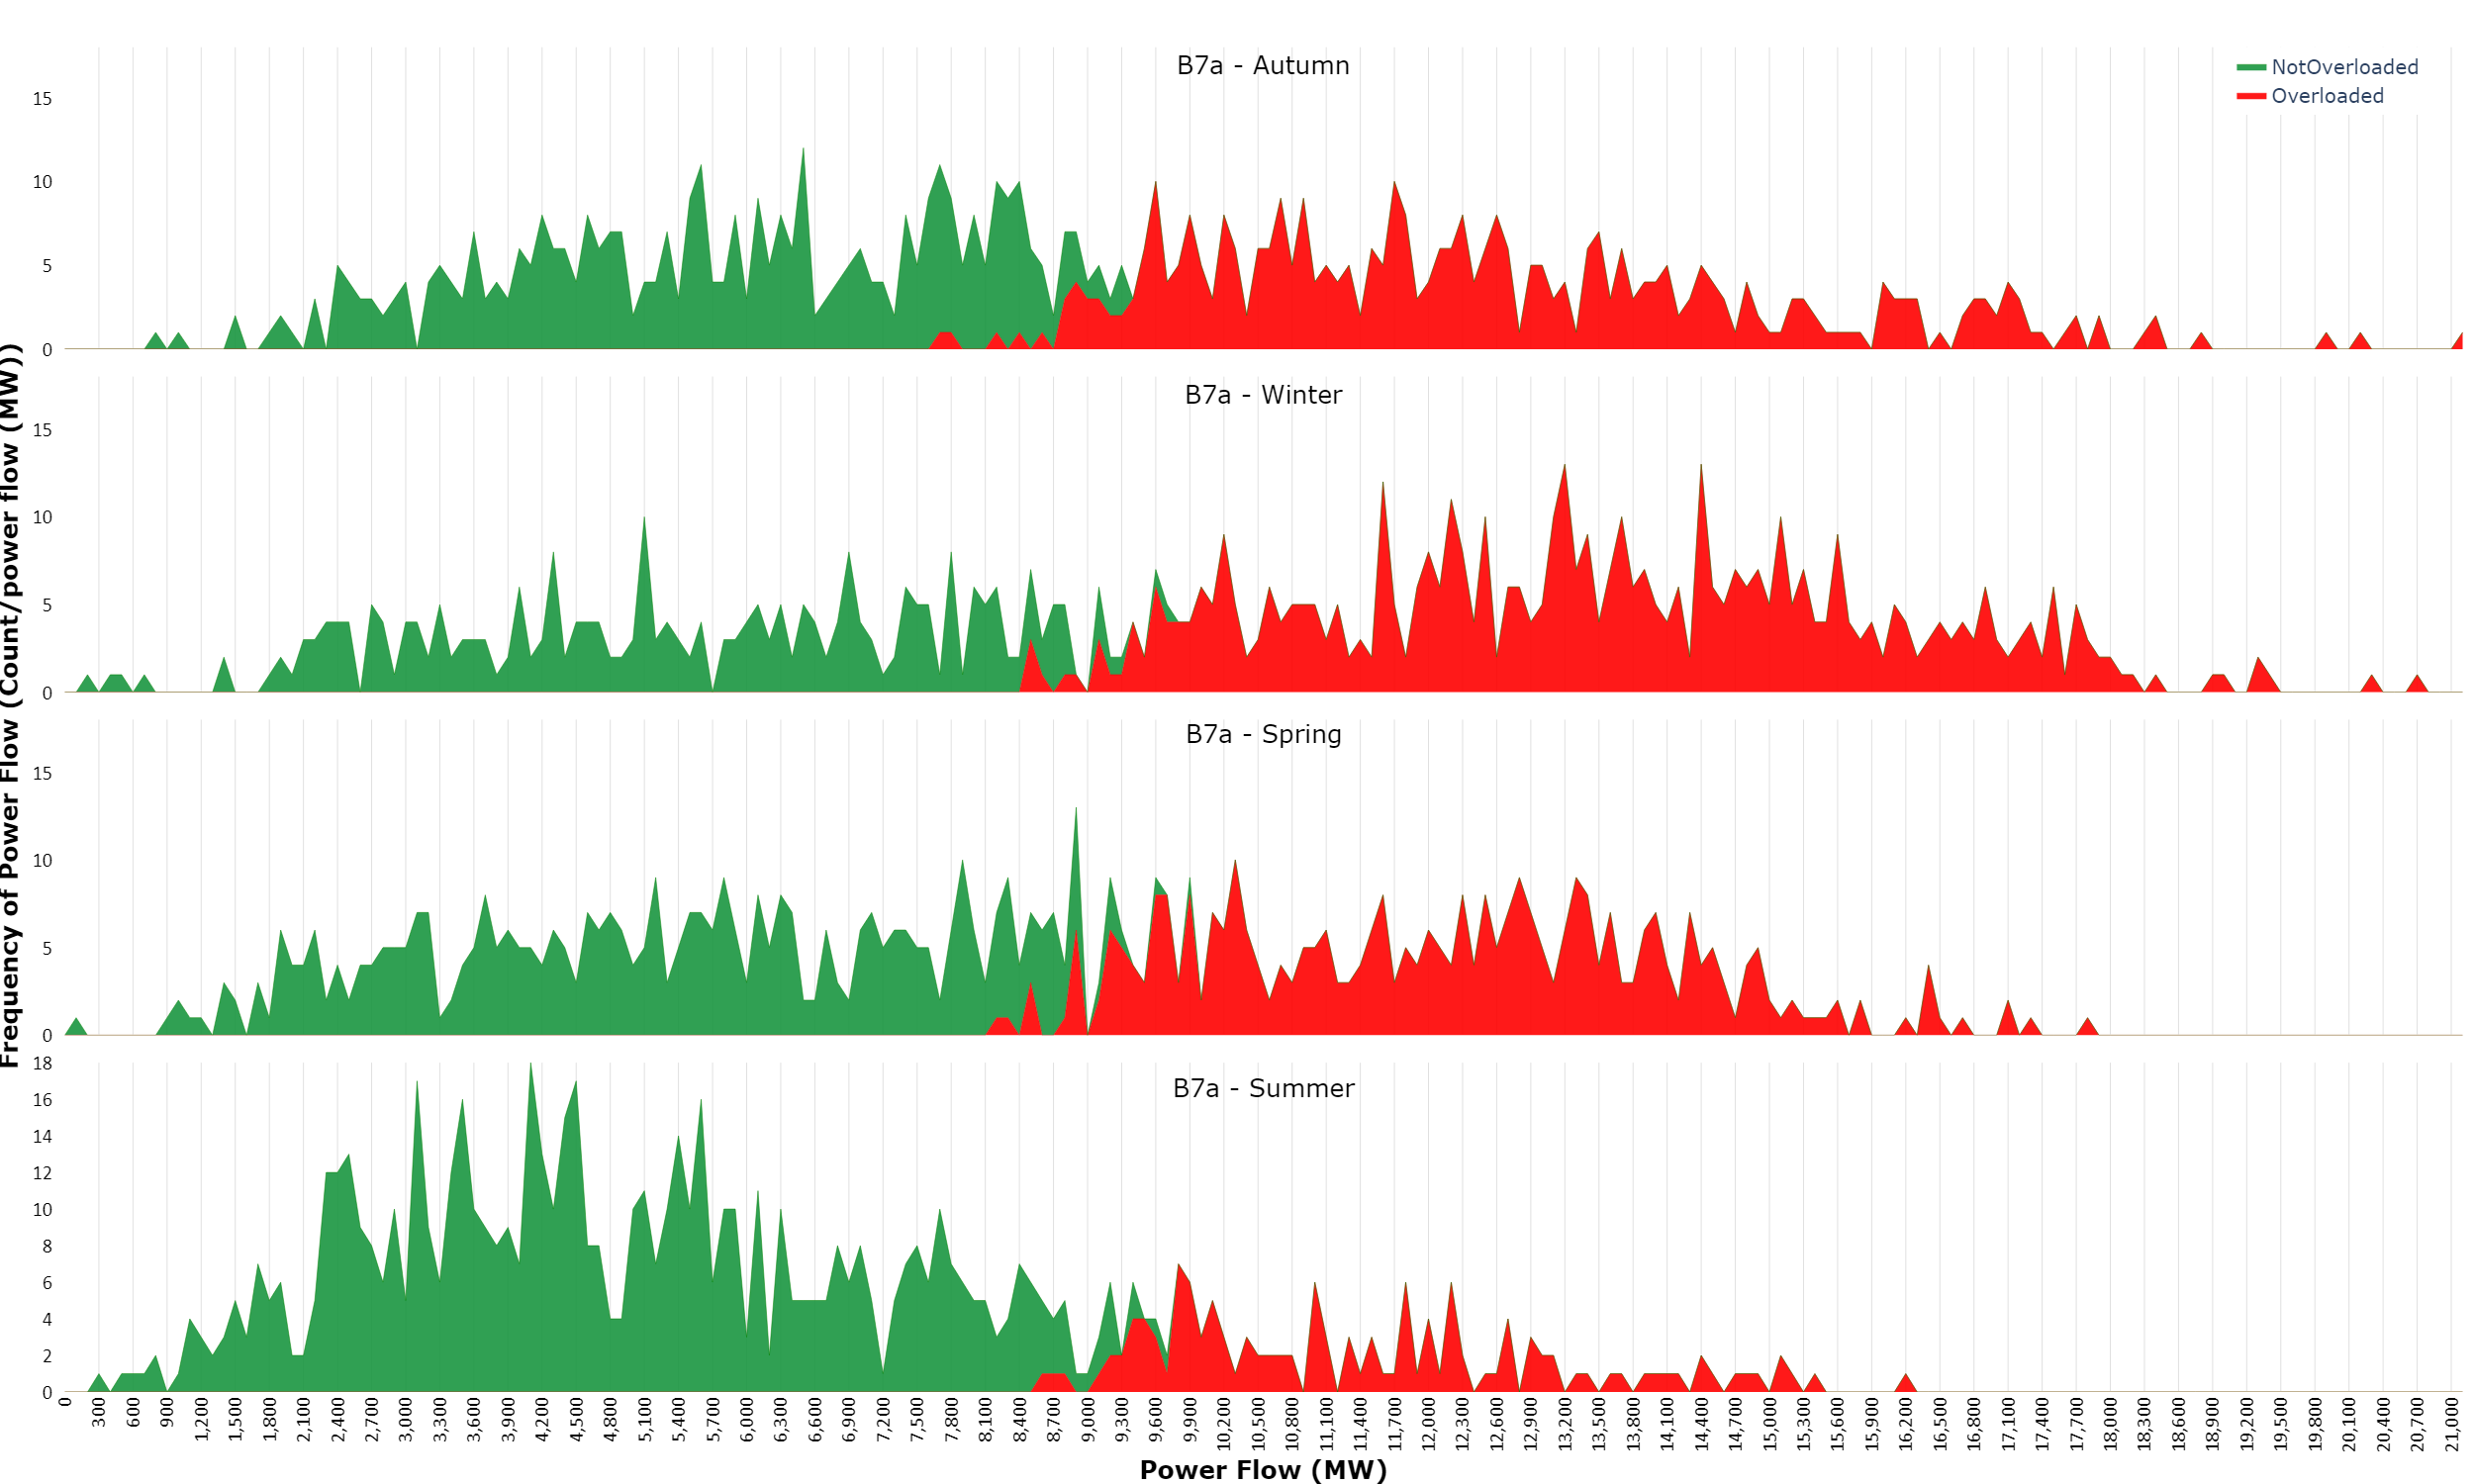
In the chart below we can see how this looks split by season. We can see that in summer the majority of flows occur below 8500MW and do not result in overloading. Flows above this are less frequent in the summer, winter however has more frequently overloaded snapshots for power flows above 8500MW closely followed by autumn.
Download a larger version of the image
As per the POUYA study, the boundary can accommodate power flows of up to 8.5GW without overloading any asset during winter season. Most overloads are seen in winter and autumn, followed by spring and summer. The asset which experienced overload was Carrington – Daines 400kV followed by Keadby – Creyke Beck (Keadby side section).
System needs – constrained assets
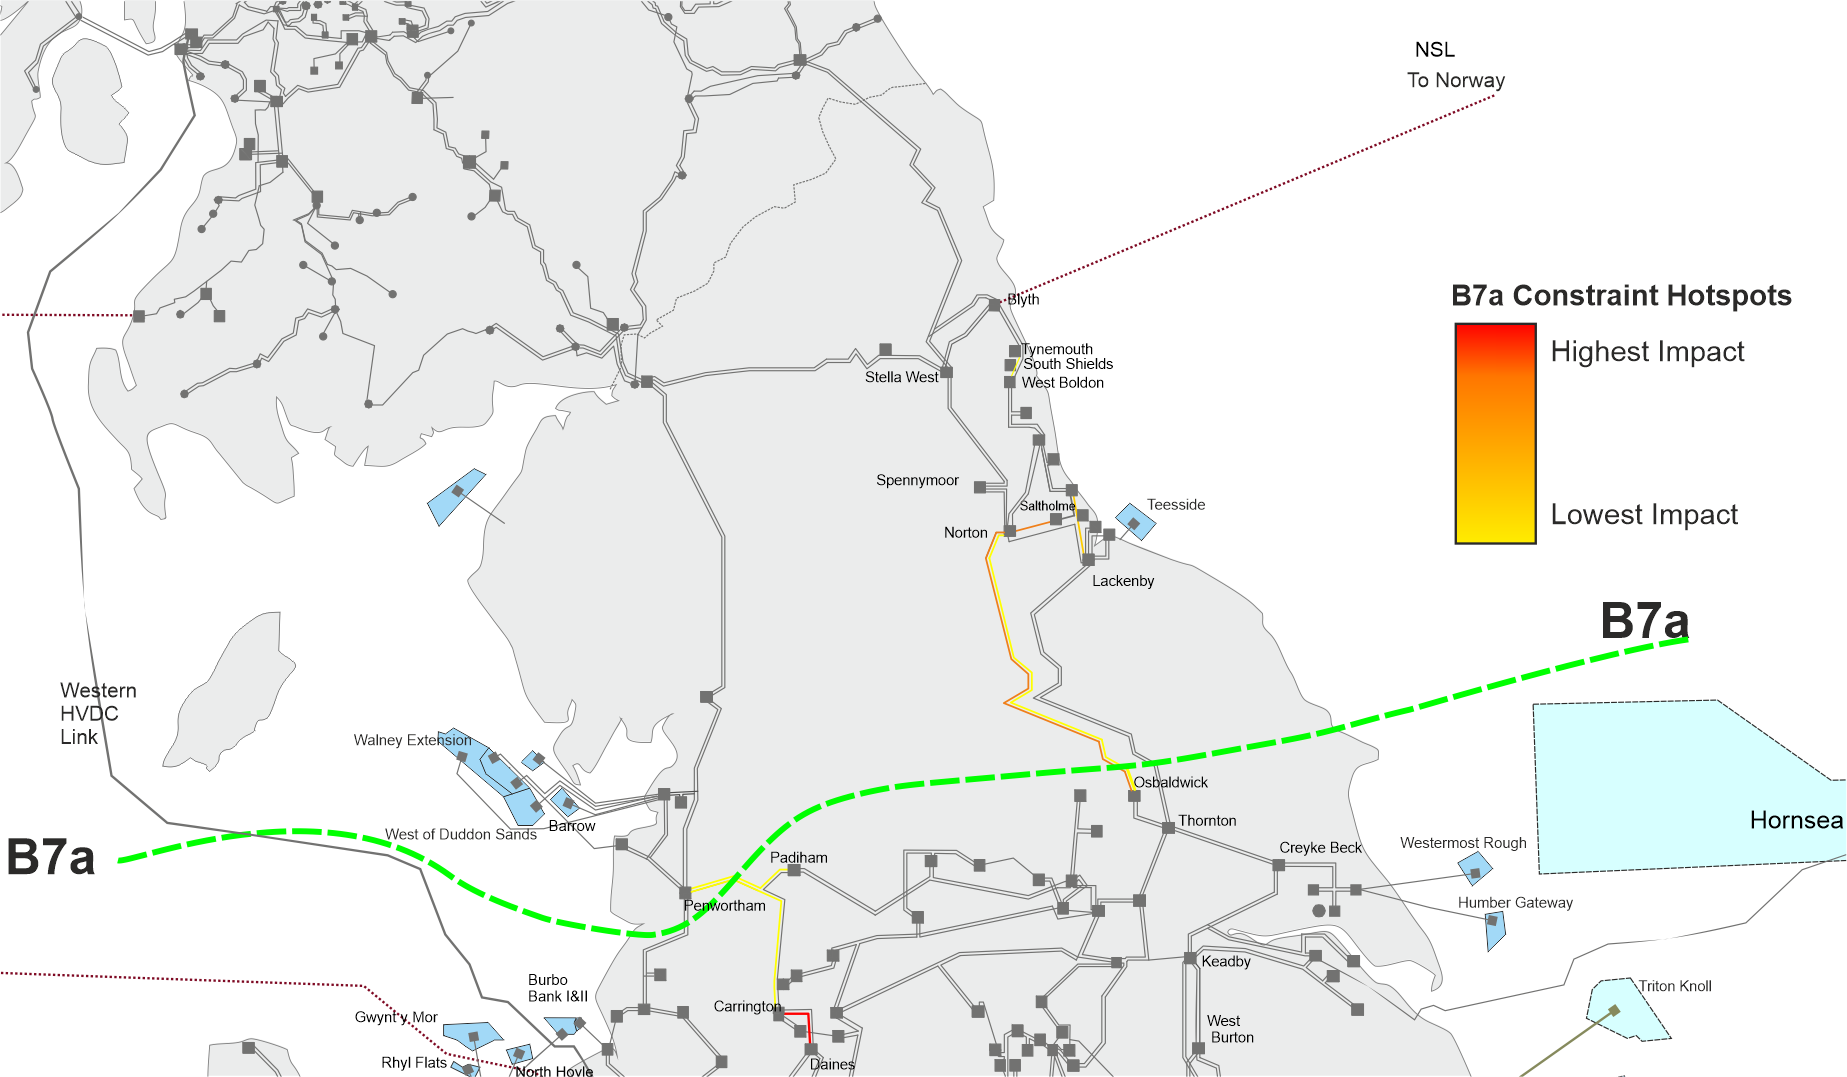
The map below shows a geographical representation of the transmission assets which experienced overloading across all seasons for the B7a contingencies.
Download a larger version of the image
The most prominent constraint identified for the B7a boundary was the Norton–Osbaldwick 400kV circuit, followed by the Carrington–Daines and Lackenby–Saltholme–Norton 400kV circuits. Most constraints identified across B7a were on the eastern side of the network, along or close to the Norton and Keadby area. Across the seasons we see the same assets constrained, and the most severe constraints are seen in winter.
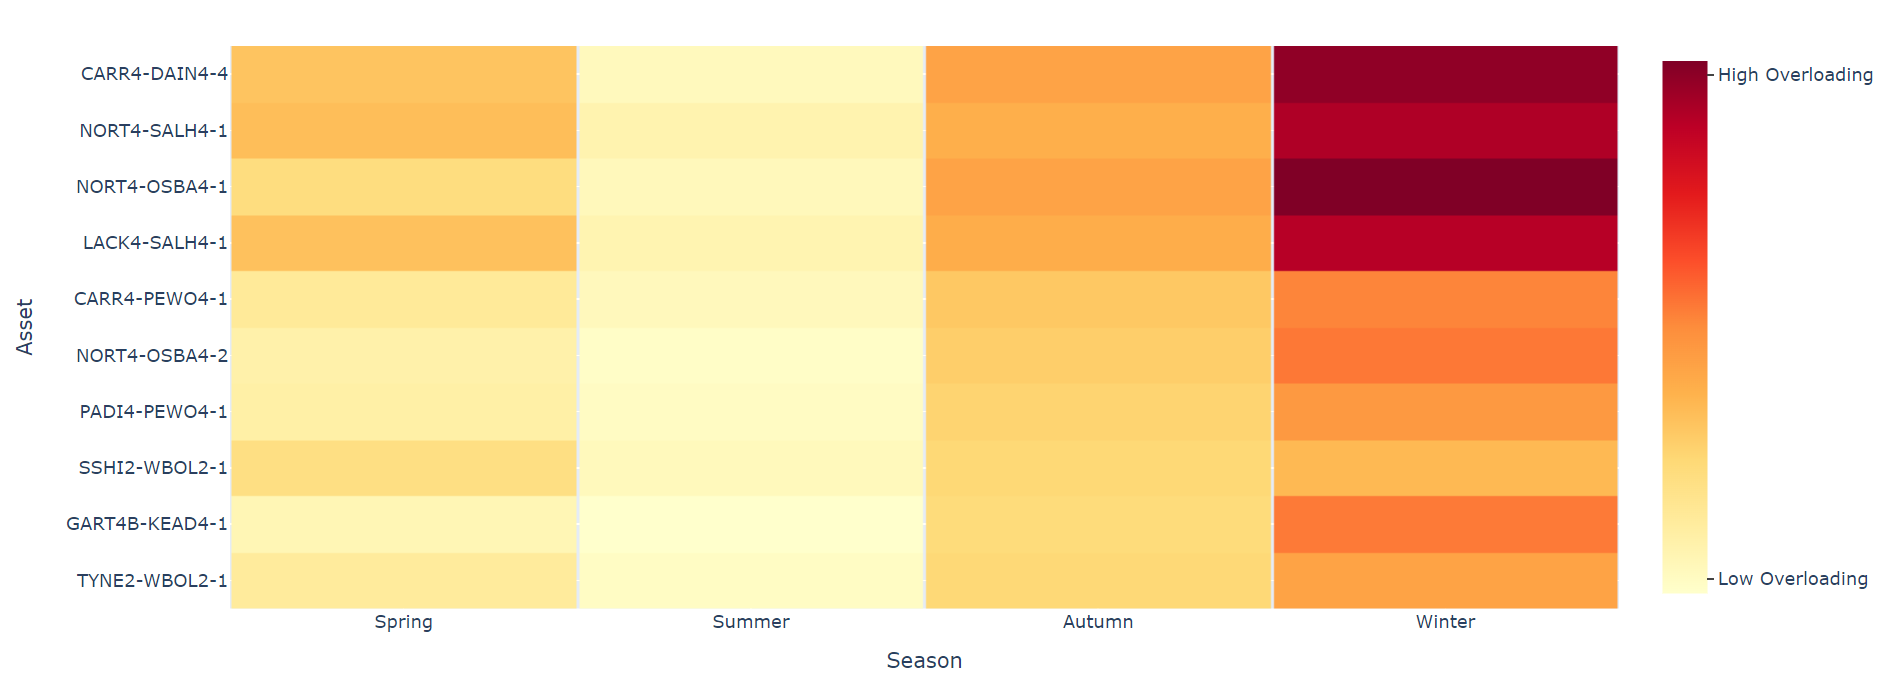
View an interactive version of the graph
All assets associated with B7a follow a general trend of experiencing the most overloading in winter peak, compared with the other seasons.
In the year 1 boundary studies conducted for ETYS 2022, the limiting asset was identified as the Penwortham–Washway Farm 275kV circuit. However, with the installation of additional static synchronous series compensator (SSSC) modules at Penwortham, this issue has been resolved.
As the ESO enters the next phase of our network planning cycle with the Transmission Owners and other interested parties (the TCSNP2), we will assess the need for network reinforcement or non-build solutions within the region and GB-wide.
System needs – boundary transfers
Boundary LE1 encompasses the south-east of the UK, incorporating London and the areas to the south-east of it. Several interconnectors to the continent are located behind this boundary.
Download a larger version of the image
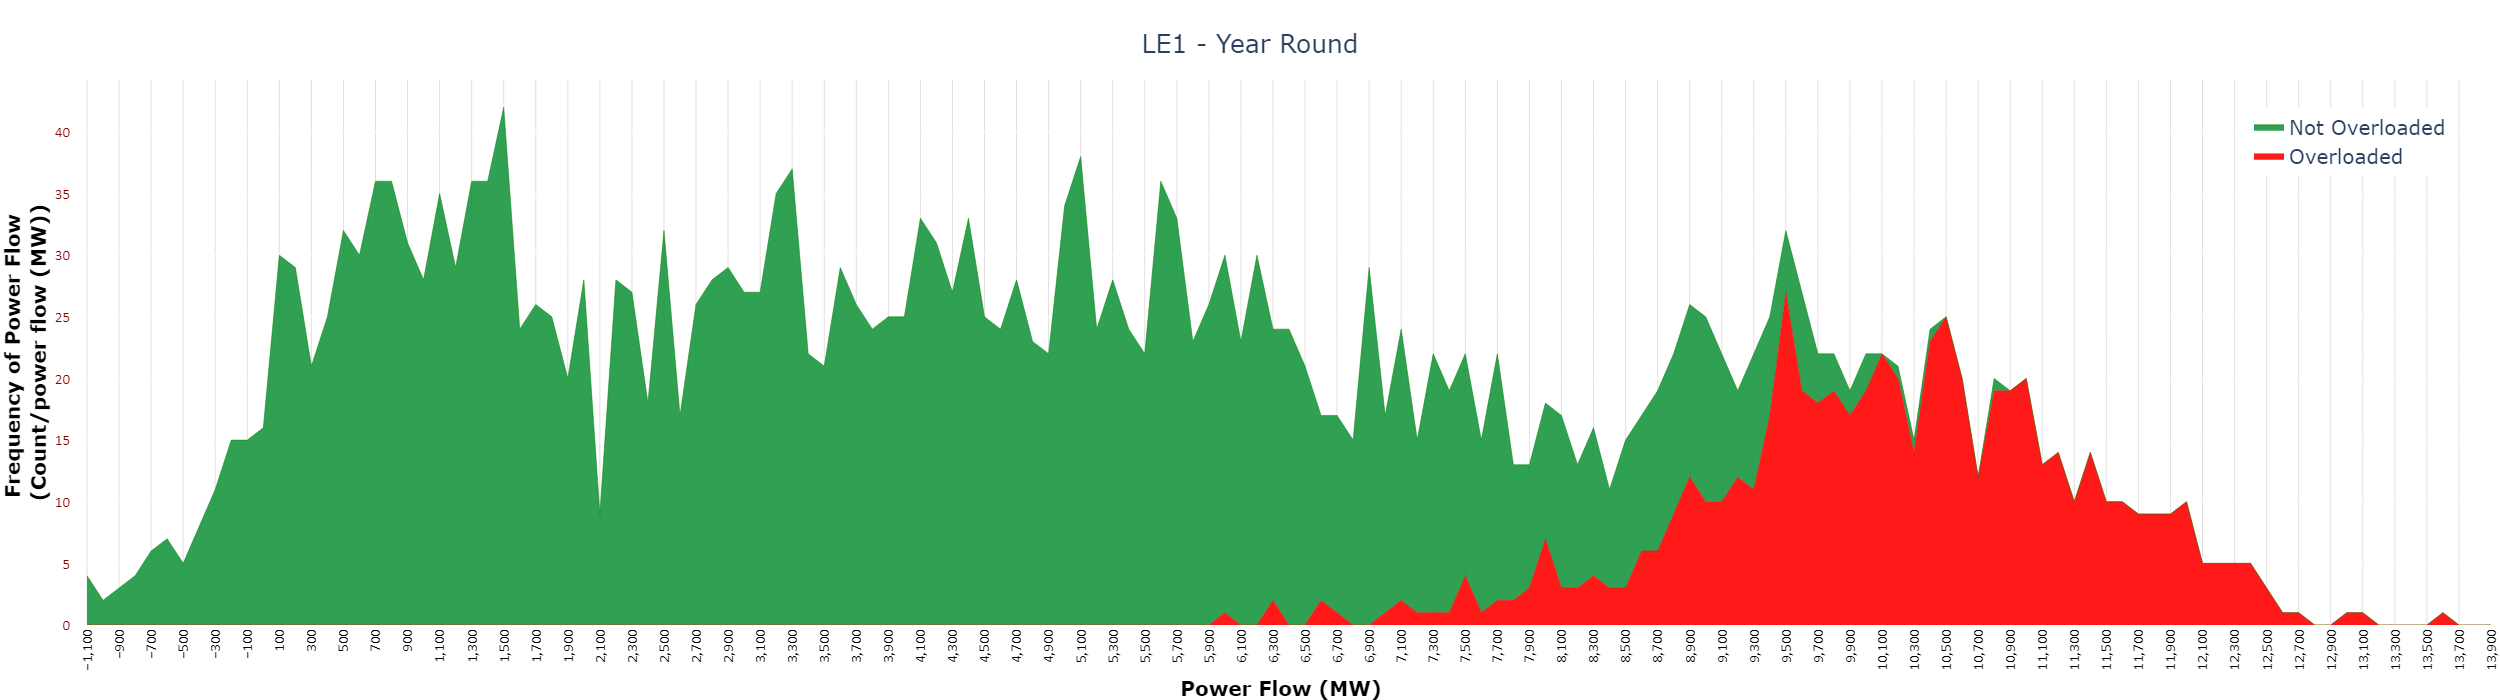
In ETYS 2022, the year 1 winter-peak boundary capability for LE1 was identified as 9.6GW. As shown in the above chart, the overloaded and not overloaded outcomes may overlap, and acceptable boundary transfers may occur at flows higher than the traditionally identified winter-peak boundary capability.
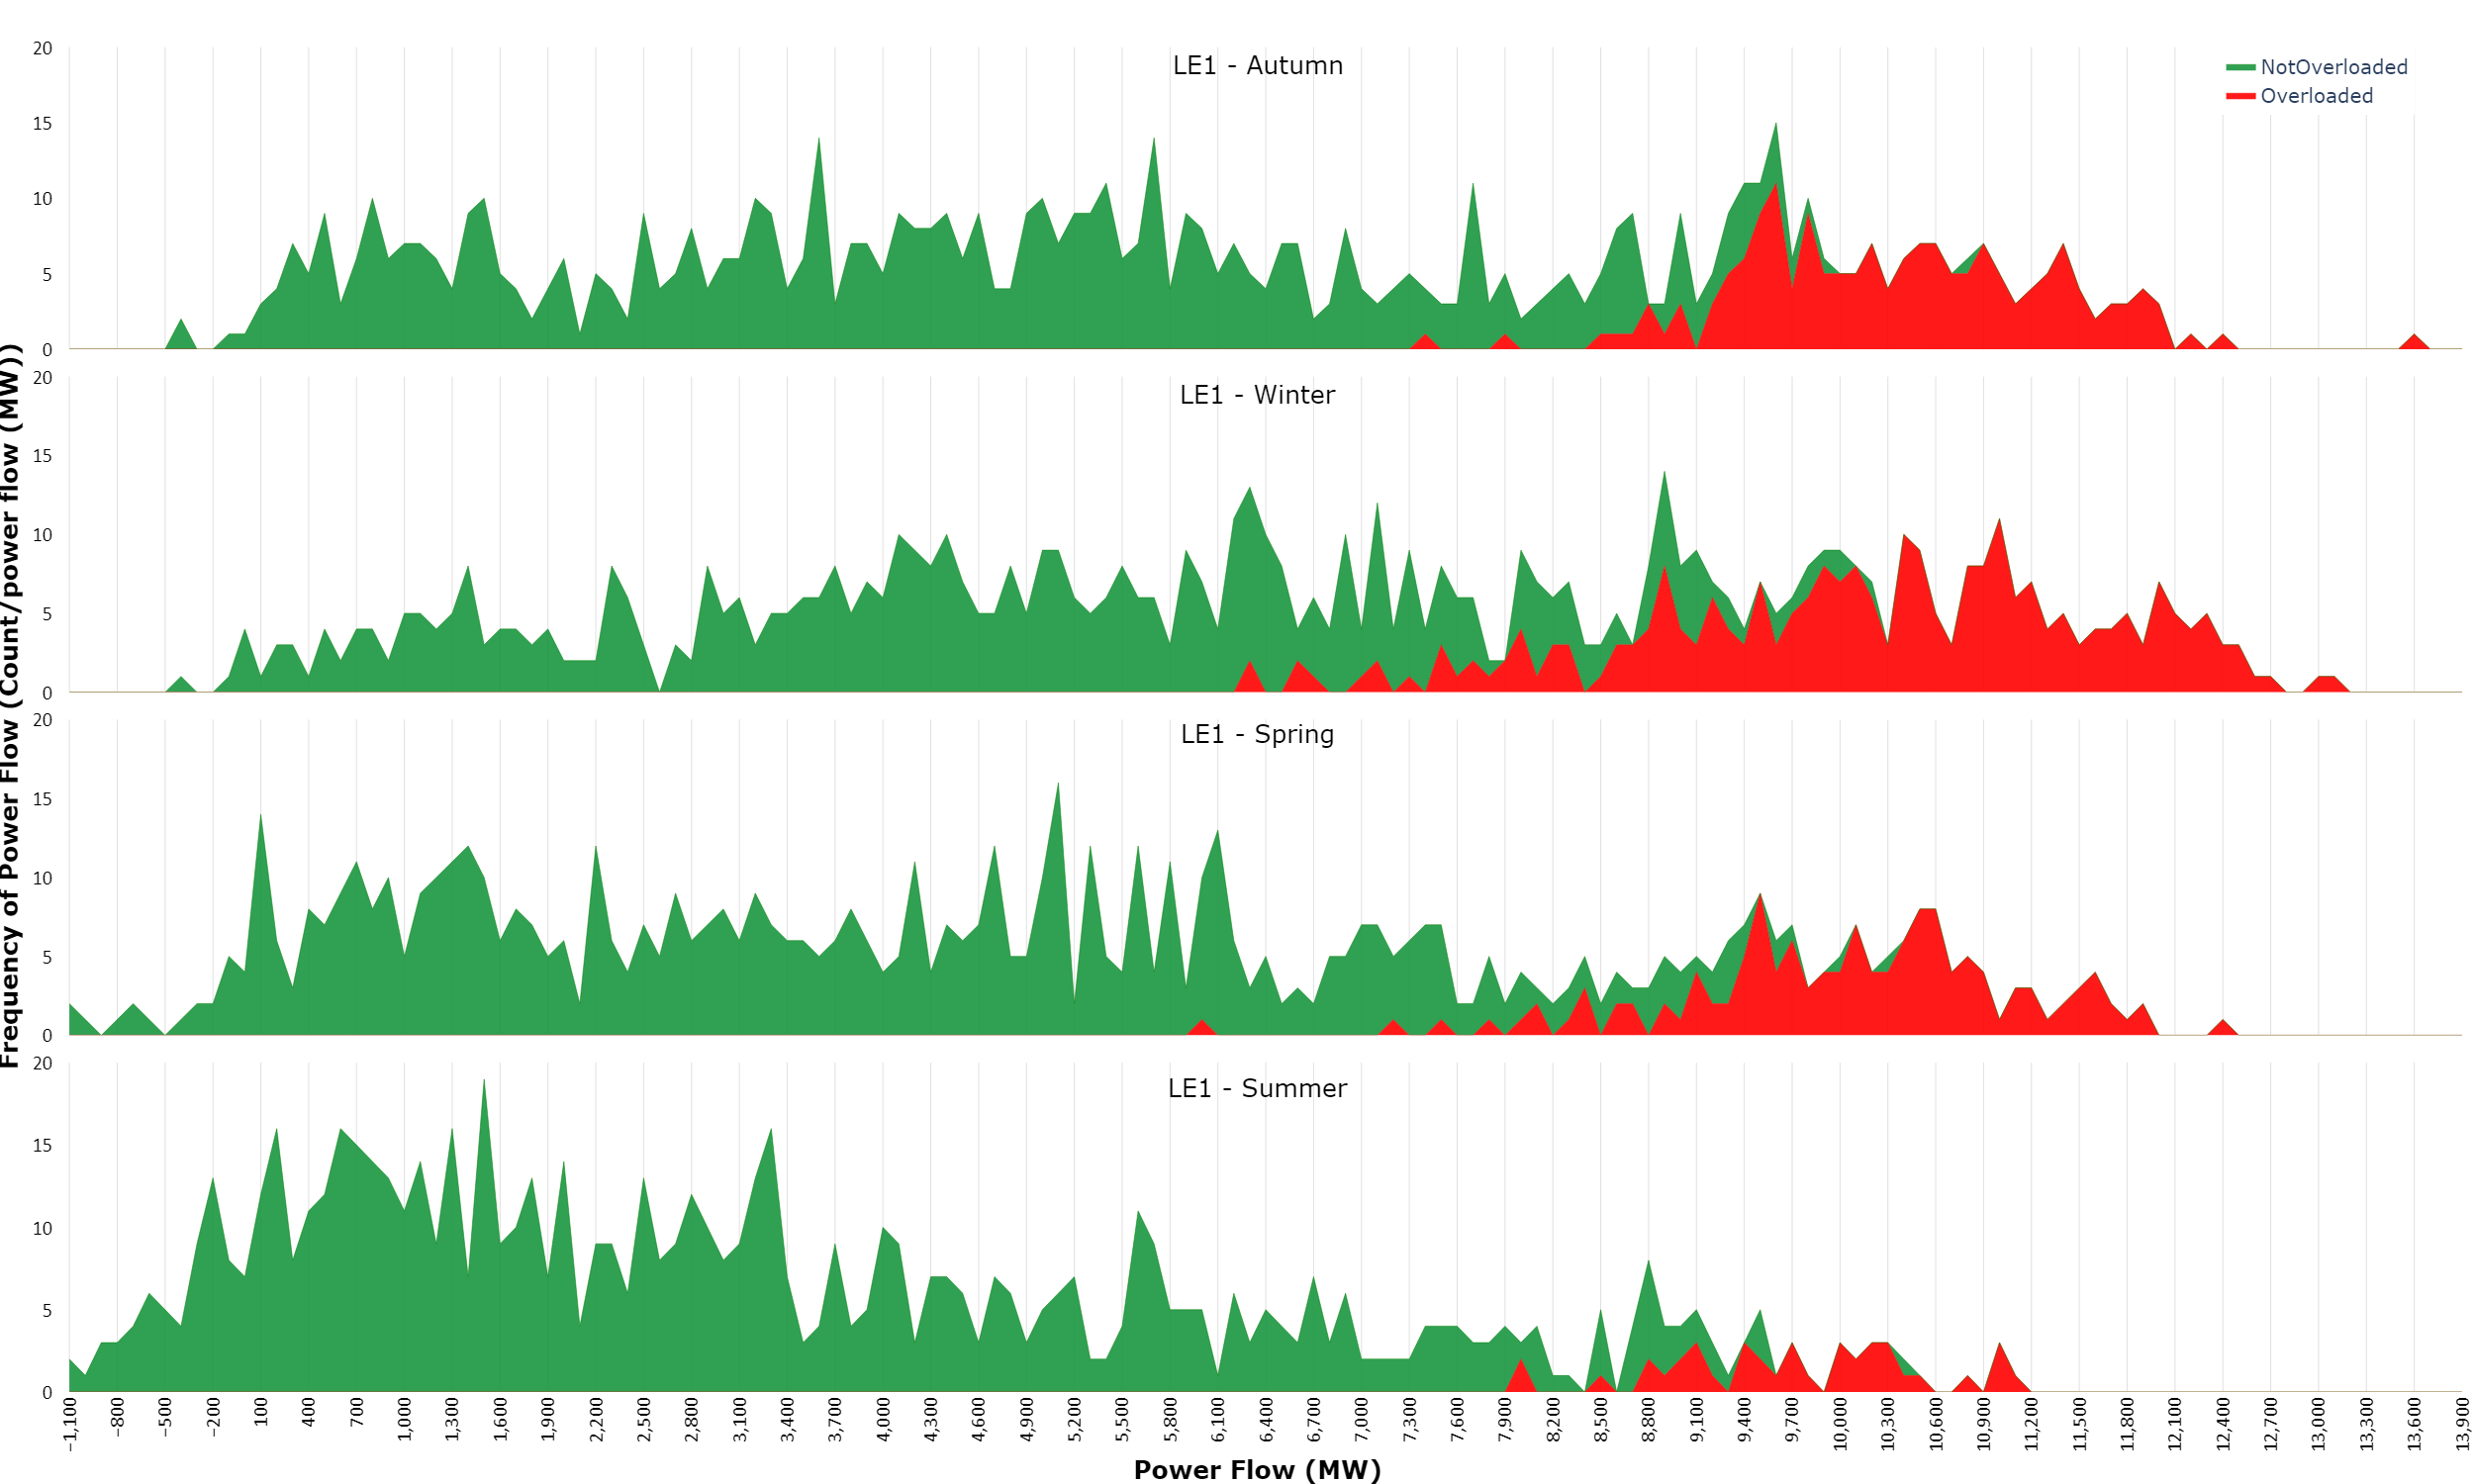
In the chart below we can see how this looks split by season. We can see that in summer power flows of up to 7900MW can be transferred without overloading. For winter however, overloads are more frequent and are seen for flows above 6300MW. Winter has the most occurrences of ‘overloaded’ snapshots, closely followed by autumn. The asset which experienced overload was Bramford – Braintree 400kV followed by Bulls Lodge – Rayleigh Main 400kV and Braintree - Bulls Lodge 400kV circuits at a boundary transfer of 7900MW.
Download a larger version of the image
System needs – constrained assets
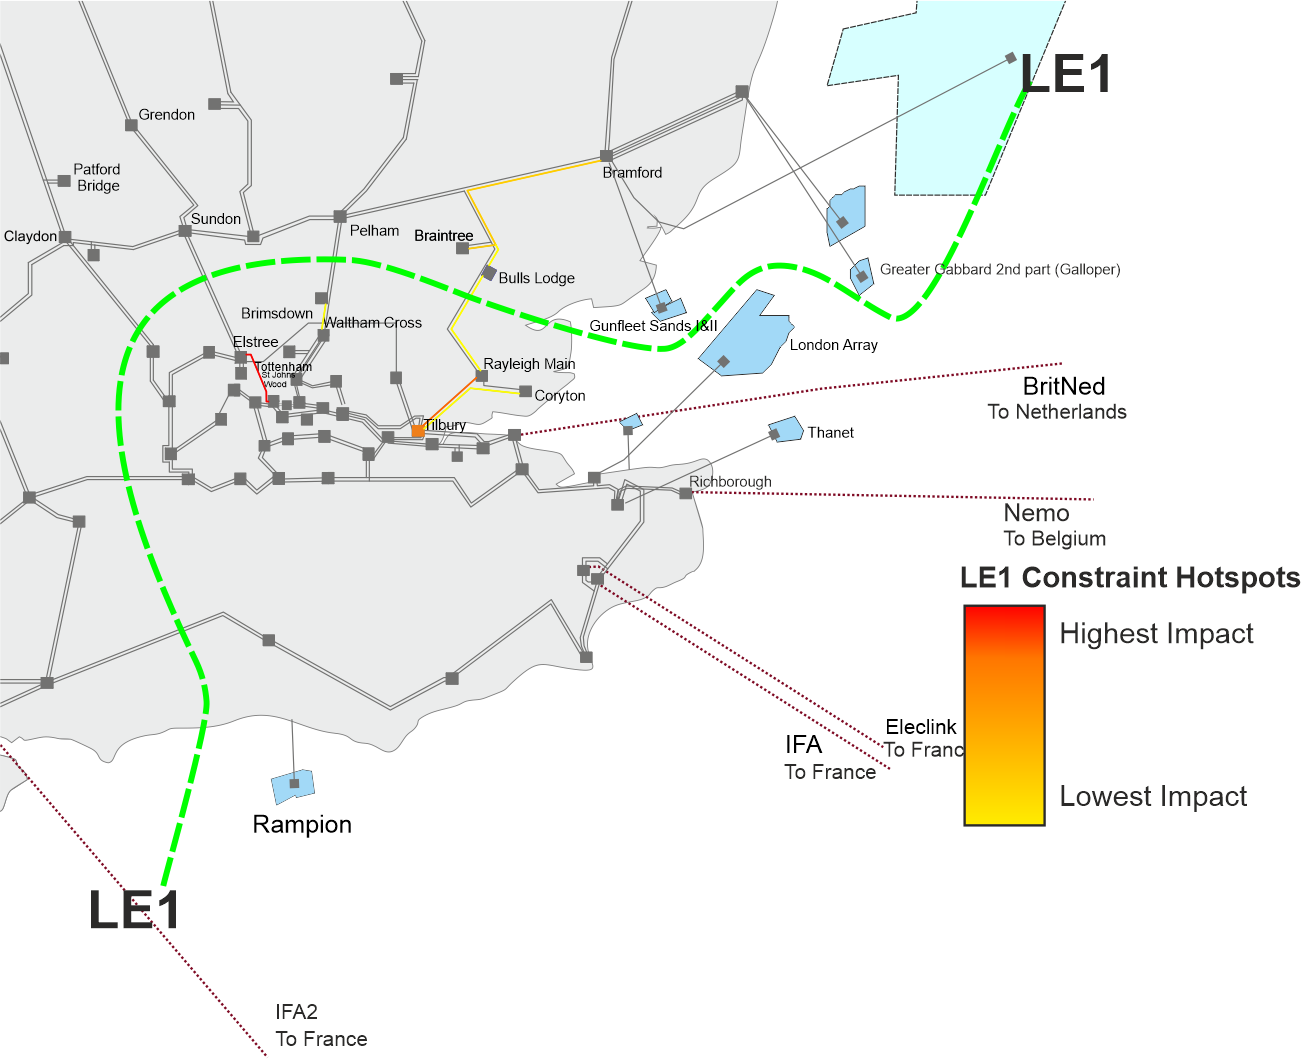
The map below shows a geographical representation of the transmission assets which experienced overloading across all seasons for the LE1 contingencies.
Download a larger version of the image
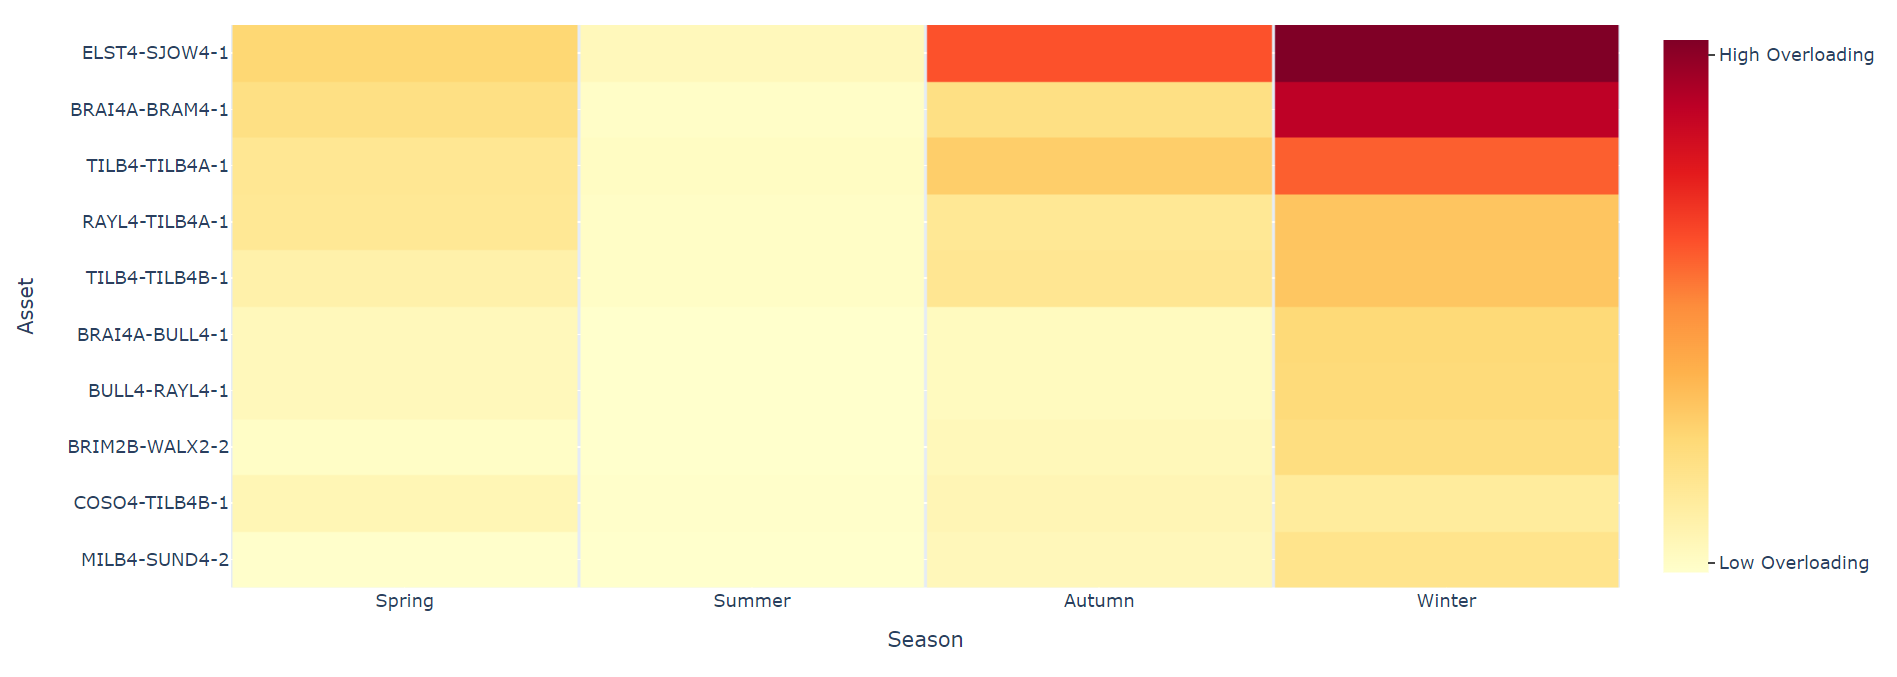
The most prominent constraint identified for the LE1 boundary was the Elstree–St. John’s Wood 400kV circuit, followed by the Bramford–Braintree 400kV and Rayleigh Main–Tilbury 400kV circuits. Most constraints identified across LE1 were on the eastern side of the network, along or close to the Bramford–Bulls Lodge and Rayleigh Main–Tilbury routes. Across the seasons we see the same assets constrained, and the most severe constraints are seen in winter.
In the year 1 boundary studies conducted for ETYS 2022, the limiting asset was identified as the Elstree–Sundon 400kV circuit. However, reconductoring the Elstree–Sundon circuit 1 A605 as highlighted in the NOA7 refresh reinforcement (SER1) to this asset are expected to be delivered before 2025, which will alleviate this limitation.
As the ESO enters the next phase of our network planning cycle with the Transmission Owners and other interested parties (the TCSNP2), we will assess the need for network reinforcement or non-build solutions within the region and GB-wide.
View an interactive version of the graph
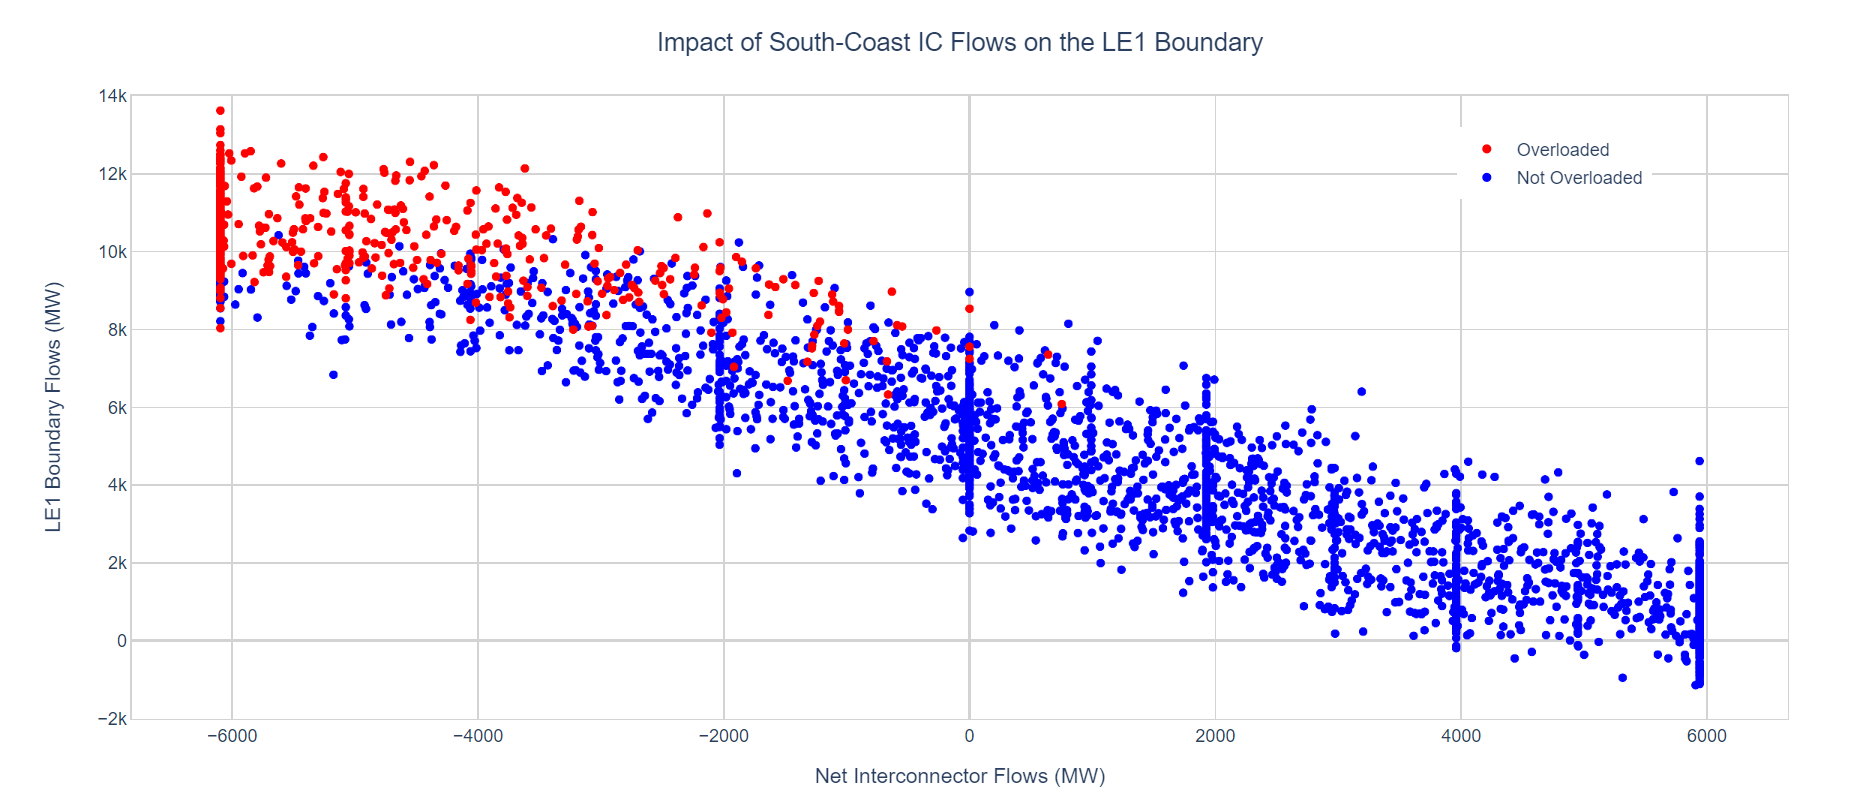
System needs – impact of interconnector flows
Five continental interconnectors are on the south coast, behind or close to the LE1 boundary. Power flows across LE1 are heavily dependent on the action of these interconnectors, with the effect of net south coast interconnector flows on LE1 boundary flows illustrated in the chart below.

View an interactive version of the graph
Whilst interconnectors are importing power from the continent, these flows can serve demand in London and reduce the need for transfers across LE1. Typically, limited constraints are seen.
However, whilst there is a net export on these interconnectors, LE1 can become a higher demand area, with any locally generated power feeding straight into the interconnectors. As such, the circuits entering LE1 from the north can become overloaded as power is drawn into and through London toward the south and east.