

South Wales and South England boundaries
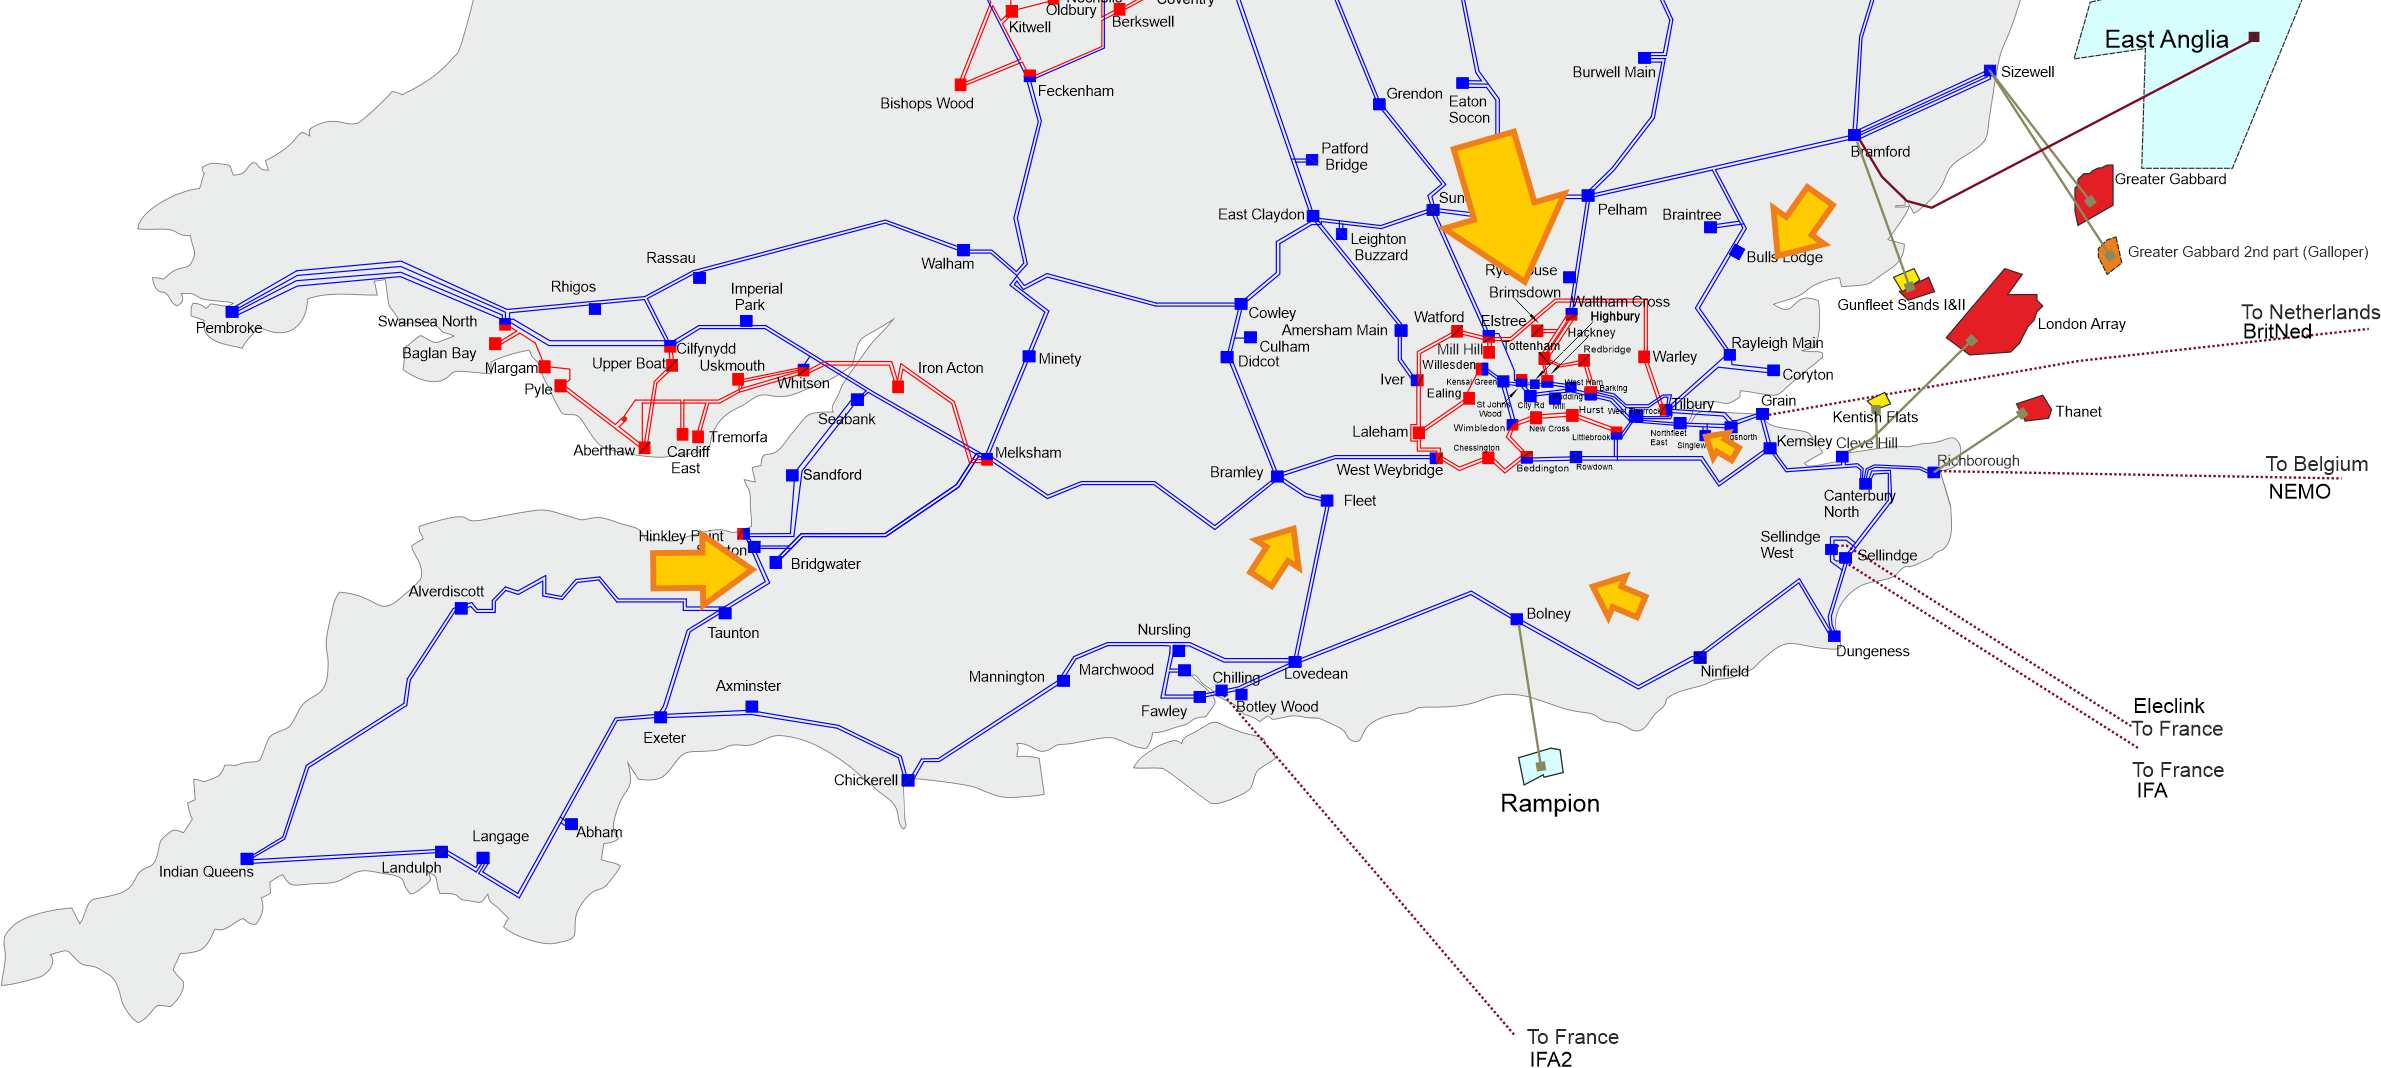
The region includes the high demand area of London, generation around the Thames estuary, and the long set of circuits that run around the south coast and South Wales.
Interconnection to central Europe is connected along the south east coast. This interconnection has significant influence on power flows in the region by being able to both import and export power with Europe.
The south of England transmission region includes boundaries B13, B14, LE1, SC1, SC1.5, SC2, SC3, and SW1.
The figure below shows the general pattern of power flow directions expected to occur most of the time in the years to come up to 2033, i.e. power will generally flow from north to south. The arrows in the diagram illustrate power flow directions and are approximately scaled relative to the winter peak flows.
Regional thermal drivers – South Wales and South England
European interconnector developments along the south coast could potentially drive very high circuit flows, causing circuit overloads, voltage management, and stability issues.
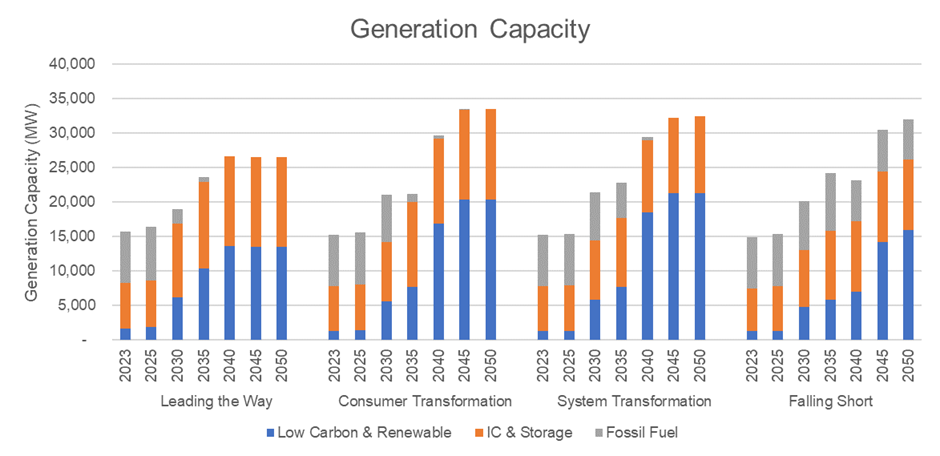
The "Leading the Way" FES scenario suggests that a total of over 10GW of interconnectors and energy storage capacity may connect in the south by 2030, up from 6.5GW to date. Interconnectors and storage are bi-directional, meaning that the south could see their capacity provide almost 10GW power injection or 10GW increased demand, placing a very heavy burden on the transmission network.
Most interconnectors will be connected south of boundary SC1 so the impact will be discussed later in the chapter in the SC1, SC1.5 and SC2 requirements. With future additional interconnector connections, in the south region it will be challenging to support all interconnectors importing or exporting simultaneously without network reinforcement. With new interconnector and generation connections, boundaries SC1, SC1.5, SC2, SC3, LE1 and B13 will need to be able to support large power flows in both directions.
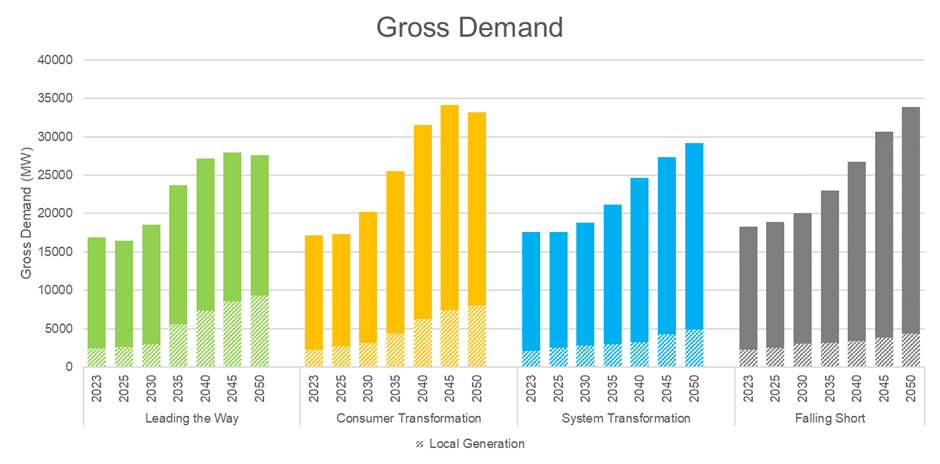
The south is expected to fulfil a smaller portion of its demand from local embedded generation than other regions are. The transmission network in the south is heavily meshed in and around the London boundary B14 and the Thames estuary, but below there and towards the west the network becomes more radial with relatively long distances between substations.
As the ESO enters the next phase of our network planning cycle with the Transmission Owners and other interested parties (the TCSNP2), we will assess the need for network reinforcement or non-build solutions within the region and GB wide.
Regional voltage drivers – South Wales and South England
Over the next ten years, we could see some generation closures within this region. However, new generators are also planned to connect in this region.
The transmission network in London mainly comprises of cable circuits. Central London experiences high voltage during periods of low demand due to low line loading. This is primarily managed by switching out cable circuits to regulate the voltage. This region also relies on generation both locally and from the nearby south east region to manage the voltage.
Where available, we always utilise existing reactive assets such as reactors to manage the voltage, however some of these reactive assets are on long term fault outage and are unable to be utilised by the control room. The ESO is working closely with the Transmission Owners to get the faulty assets repaired and returned to service as soon as possible.
The South of England region has several interconnectors and during periods of large interconnector imports from the continent, faults in this area could result in low voltage.
The timing of generation closures or connections could result in some system needs in certain years. We expect to see three synchronous compensators connecting in the south east of England from 2025 as part of Stability Pathfinder Phase 3 project that could also help support voltage.
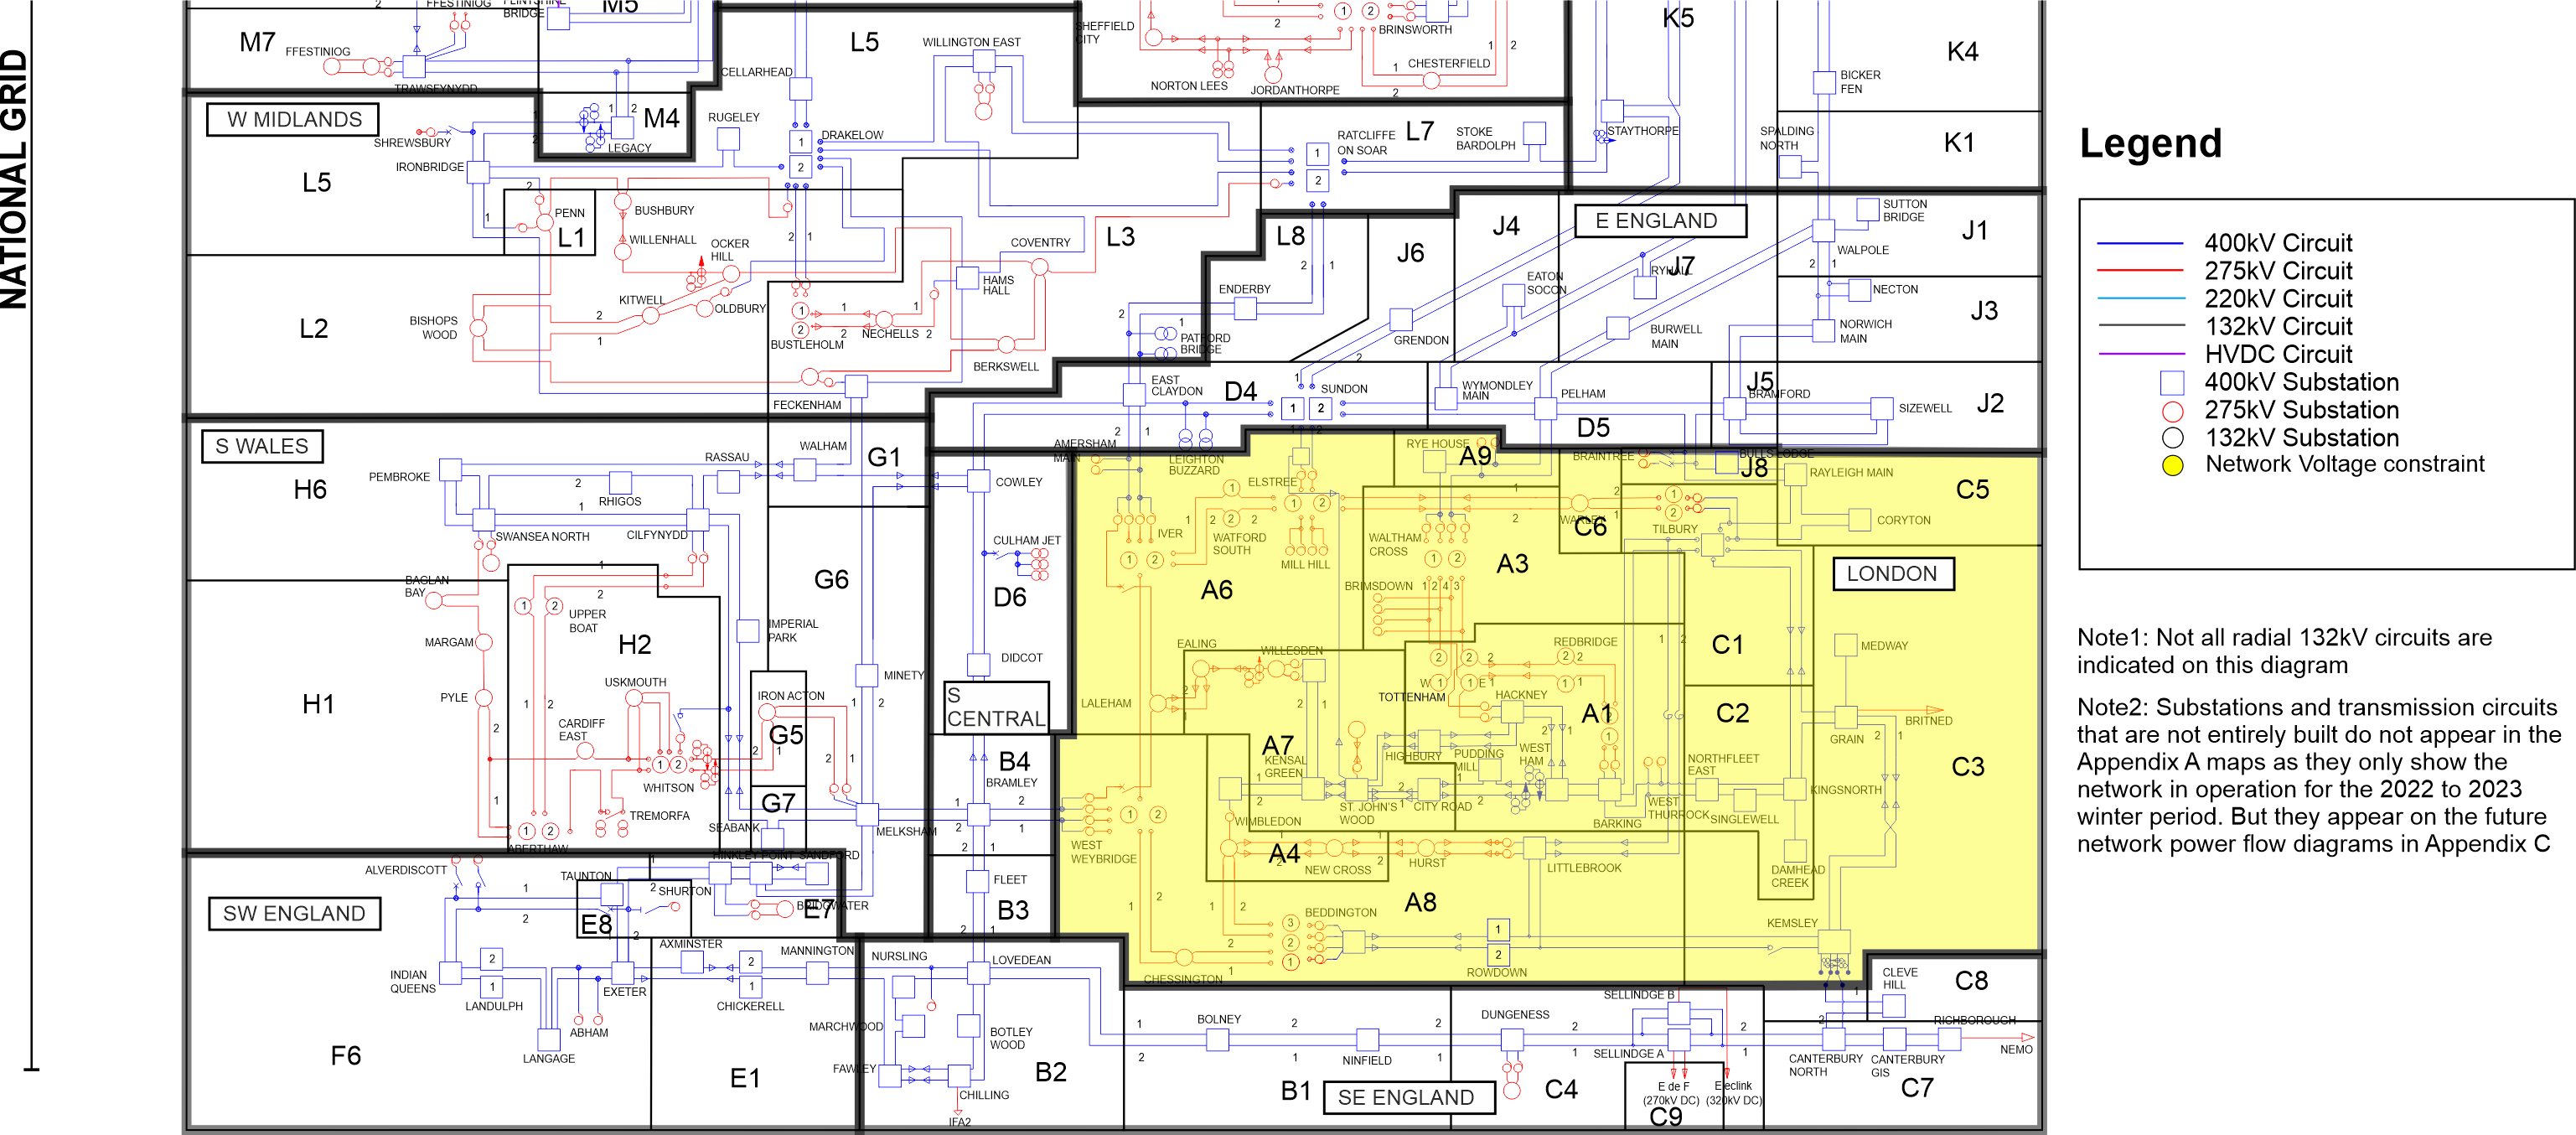
The map below shows London identified through our voltage screening process.
Download a larger version of this image
Boundary regions
Click on the regions below to expand the boundary and understand its capability and challenges.
The graphs show a distribution of power flows for each of our Future Energy Scenarios, in addition to the boundary power transfer capability and NETS SQSS requirements for the next 20 years.
Each scenario has different generation and demand so produces different boundary power flow expectations. From applying the methodology in the NETS SQSS for wider boundary planning requirements (as discussed in the previous chapter), we determine for each scenario:
- The economy criteria - solid coloured line
- Security criteria - dashed coloured line
- Current and future NOA capability (where available) - solid red line
The capability line (red line) is based on the recommendations from the Beyond 2030 report. More information about the NOA methodology can be found here. The 50%, 90%, economy required transfer (RT) and Security RT are calculated from the 2023 FES and ETYS processes. Where the NOA transfer capability is not available, there is a red line that provides the transfer capability from ETYS 2022.
Note: Boundary capability line is affected by the generation and demand profiles within each FES background. Therefore, the graphs are provided for indicative purposes only and cannot be directly compared.
The calculations of the annual boundary flow are based on unconstrained market operation, meaning network restrictions are not applied. This way, the minimum cost generation output profile can be found. We can see where the expected future growing needs could be by looking at the power flows in comparison with boundary capability.

View an interactive version of the graph
On each graph, the two shaded areas provide confidence as to what the power flows would be across each boundary:
- The darker region shows 50% of the annual power flows
- The lighter region shows 90% of the annual power flows
From the regions, we can show how often the power flows expected in the region split by the boundary are within its capability (red line). If the capability of the boundary is lower than the two regions over the next 20 years, there might be a need for reinforcements to increase the capability. However, if the line is above the shaded regions, it shows that there should be sufficient capability here and that potentially no reinforcements are needed from a free market power flow perspective until the shaded regions exceed the capability (red line).
Highlighted yellow areas on our NETS regional diagrams will show areas identified through our voltage screening process on the NETS that could face voltage needs over the next ten years. These areas have been identified through our annual voltage screening process outlined in our "About the ETYS" section and is included in our NOA methodology. These charts will be accompanied by a general commentary surrounding voltage behaviour in the regional area.
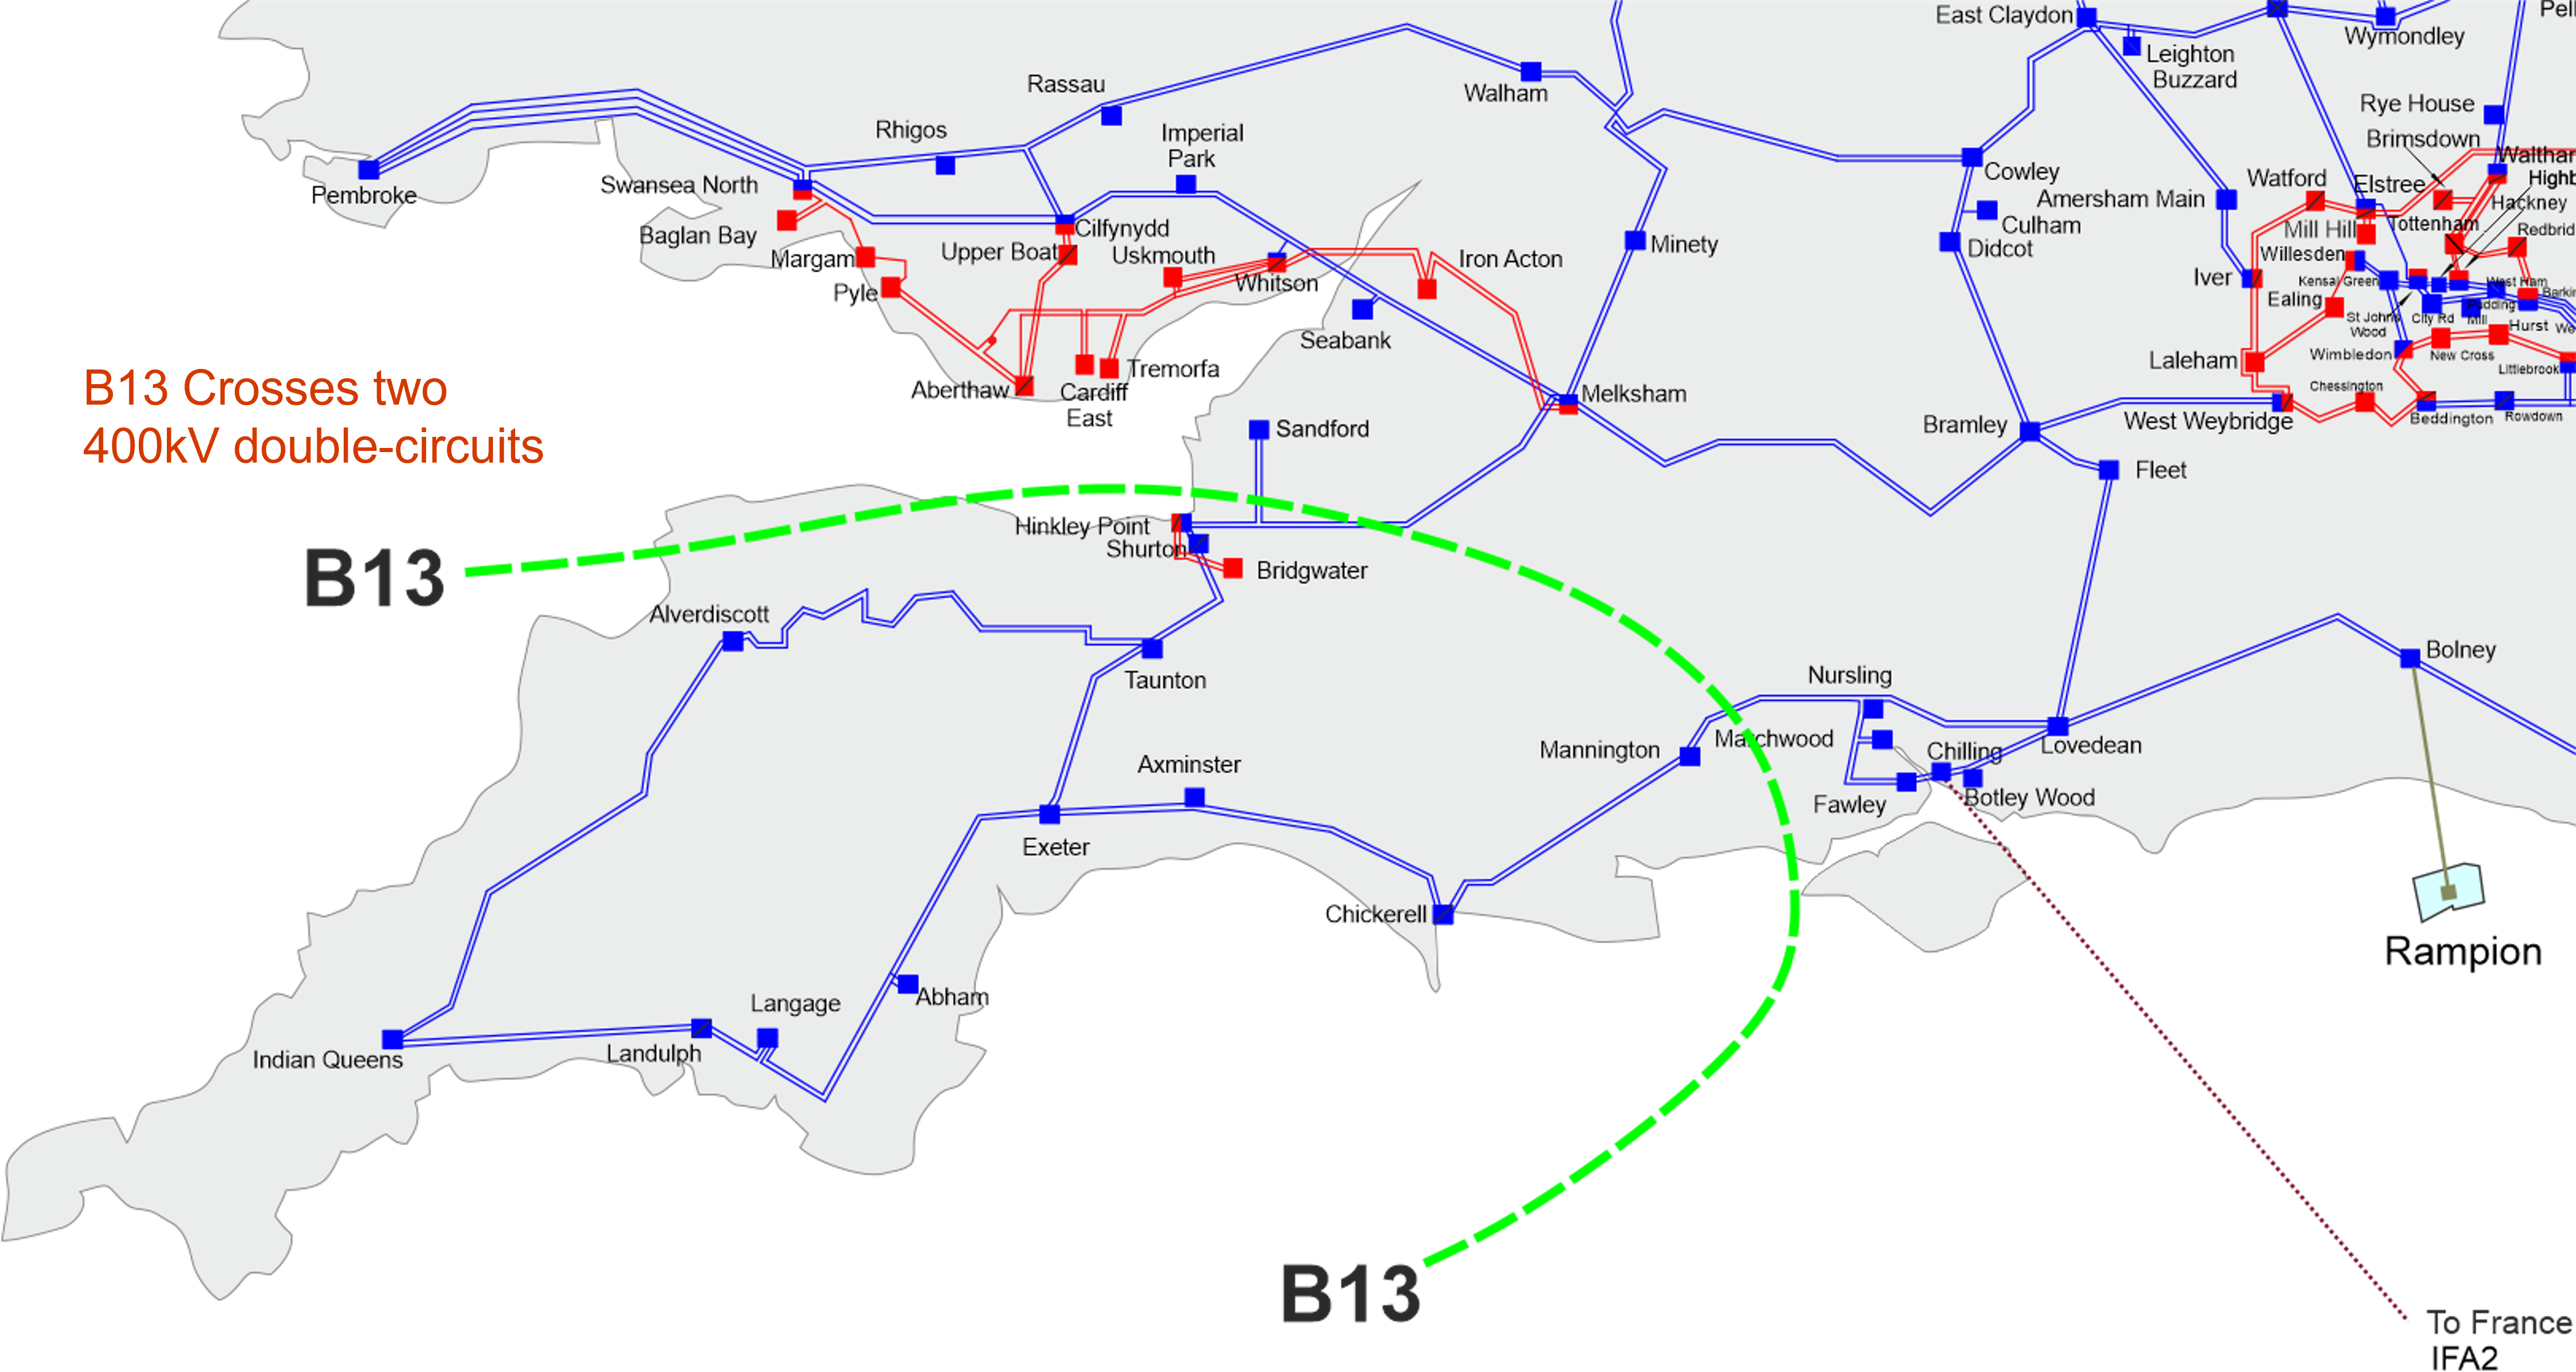
Wider boundary B13 is defined as the southernmost tip of the UK below the Severn Estuary, encompassing Hinkley Point in the south west and stretching as far east as Mannington. The southwest peninsula is a region with a high level of localised generation and demand.
Boundary flows and base capability

View an interactive version of the graph
The capability line (in red) is based on the recommendations from the Beyond 2030 report, which uses the 2023 FES and ETYS data as inputs. The 50%, 90% Economy RT and Security RT lines are based on FES 2023. The ETYS and NOA methodologies for this boundary are different and can result in different transfer capabilities.
The boundary capability is limited to 3.4GW due to a voltage compliance constraint at the Indian Queens substation.
Until new generation or interconnectors connect there is very little variation in boundary requirements for B13, and the current importing boundary capability is sufficient to meet the short-term needs.
The large size of the potential new generators wishing to connect close to boundary B13 is likely to push it to large exports and require additional boundary capacity.
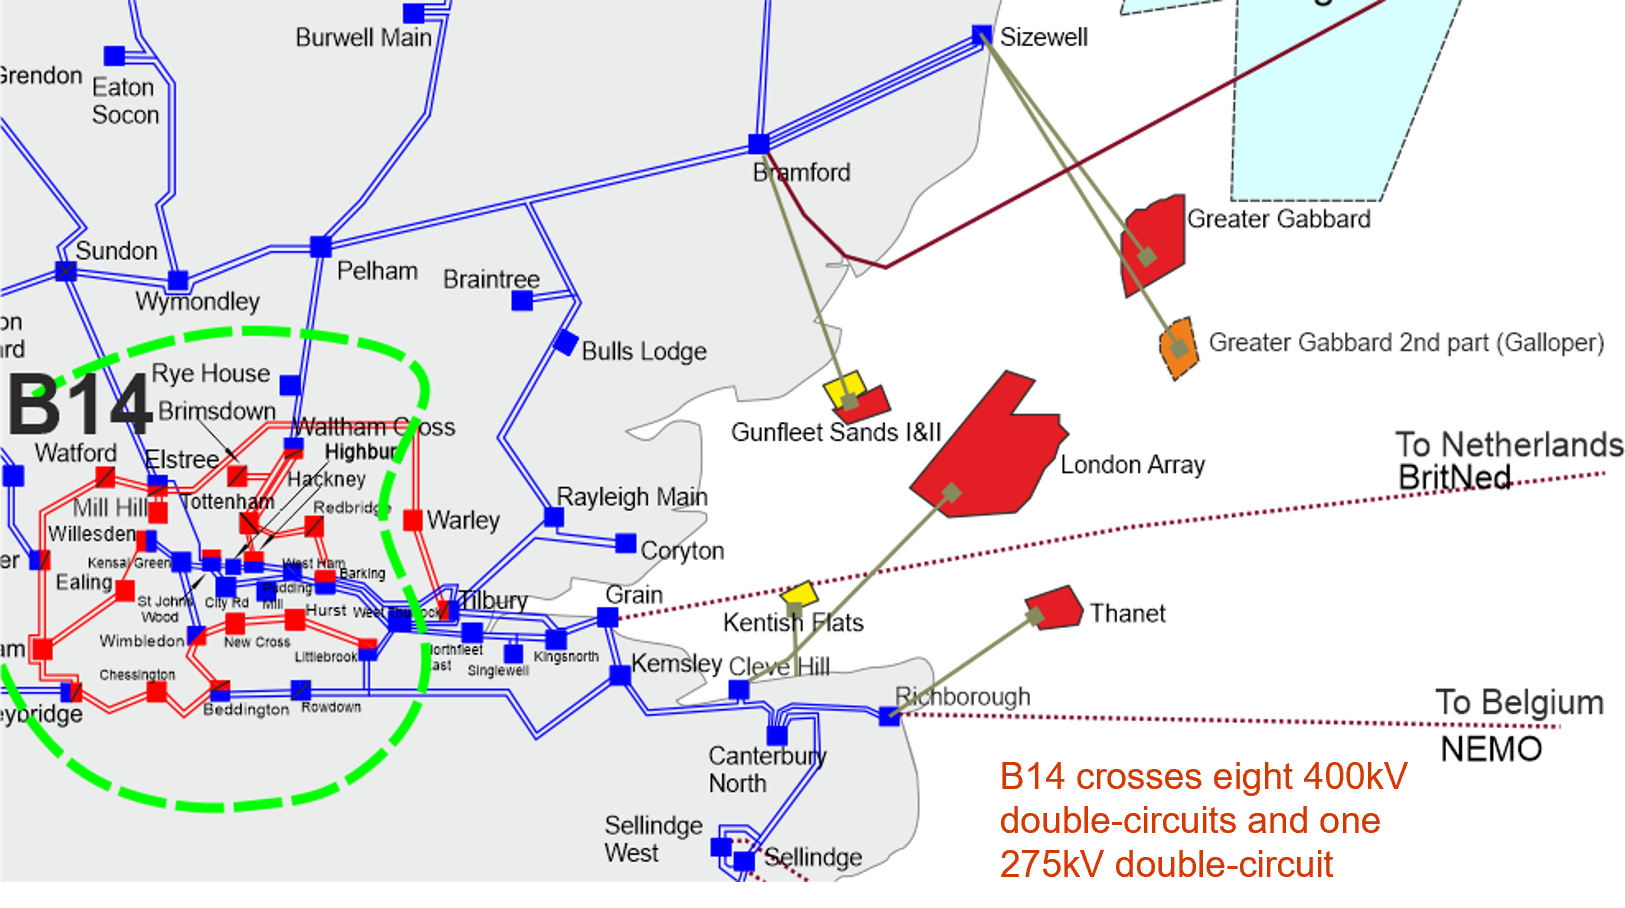
Boundary B14 encloses London and is characterised by high local demand and a small amount of generation. London’s energy import relies heavily on surrounding 400kV and 275kV circuits.
Boundary flows and base capability

View an interactive version of the graph
The capability line (in red) is based on the recommendations from the NOA 2021/22 optimal path which uses the 2021 FES and ETYS data as inputs. The 50%, 90% Economy RT and Security RT lines are based on FES 2023. The ETYS and NOA methodologies for this boundary are different and can result in different transfer capabilities.
The boundary capability is limited to 11.6GW due to a thermal constraint on the Grain–Kingsnorth and Grain–Tilbury circuits.
The circuits entering from the north can be particularly heavily loaded at winter peak conditions. The circuits are further overloaded when the European interconnectors export to mainland Europe as power is transported via London to feed the interconnectors along the south coast.
As the transfer across this boundary is mostly dictated by the contained demand, the scenario requirements mostly follow the demand with little deviation due to generation changes.
The boundary requirements are close to each other across all four scenarios for security and economy required transfer. In both criteria, the required transfer is above 90% flows, meaning planning for these values covers all possible flows.
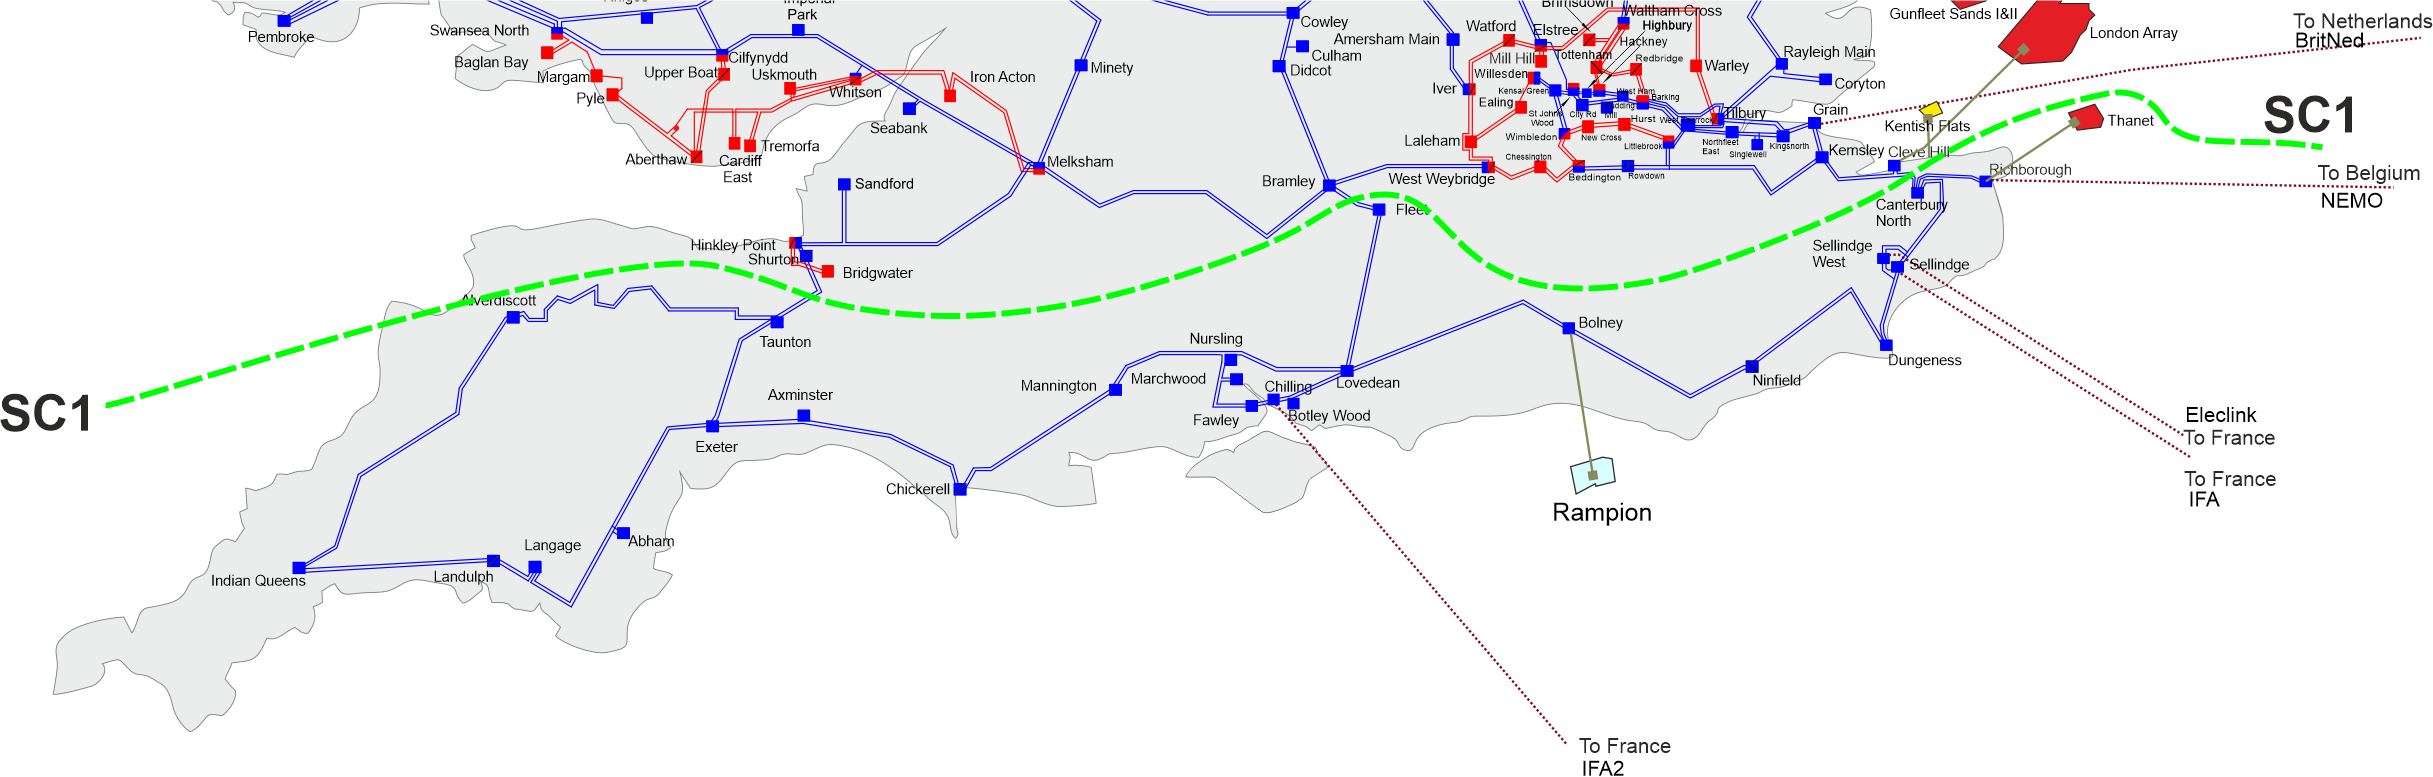
Boundary SC1 runs parallel with the south coast between the Severn and Thames estuaries.
Boundary flows and base capability

View an interactive version of the graph
The capability line (in red) is based on the recommendations from the Beyond 2030 report, which uses the 2023 FES and ETYS data as inputs. The 50%, 90% Economy RT and Security RT lines are based on FES 2023. The ETYS and NOA methodologies for this boundary are different and can result in different transfer capabilities.
The boundary capability is limited to 3.85GW due to a voltage compliance constraint at the Dungeness 400kV substation.
At times of peak winter GB demand, the power flow is typically north to south across the boundary, with more demand enclosed in the south of the boundary than supporting generation.
Interconnector activity can significantly influence the boundary power flow. The current interconnectors to France, the Netherlands, and Belgium connect at Sellindge, Grain, and Richborough respectively.
The interconnectors to Europe have a significant impact on the power transfers across SC1. A 2GW interconnector such as IFA can make 4GW of difference on the boundary from full export to full import mode or vice versa.
The biggest potential driver for SC1 will be the connection of new continental interconnectors. With their ability to transfer power in both directions, boundary SC1 could be overloaded much more than normal with conventional generation and demand.
Across all four scenarios in the FES, the SQSS security required transfer follows a generally flat pattern, whereas the economy required transfer moves from exporting to importing from 2024–2029 depending on scenario. The volatility of interconnector activity can be seen in the required transfers as the requirements swing from power flow south and north.
The SQSS calculation of required transfers does not place high loading on the interconnectors, so the transfers are not seen to peak at very high values.
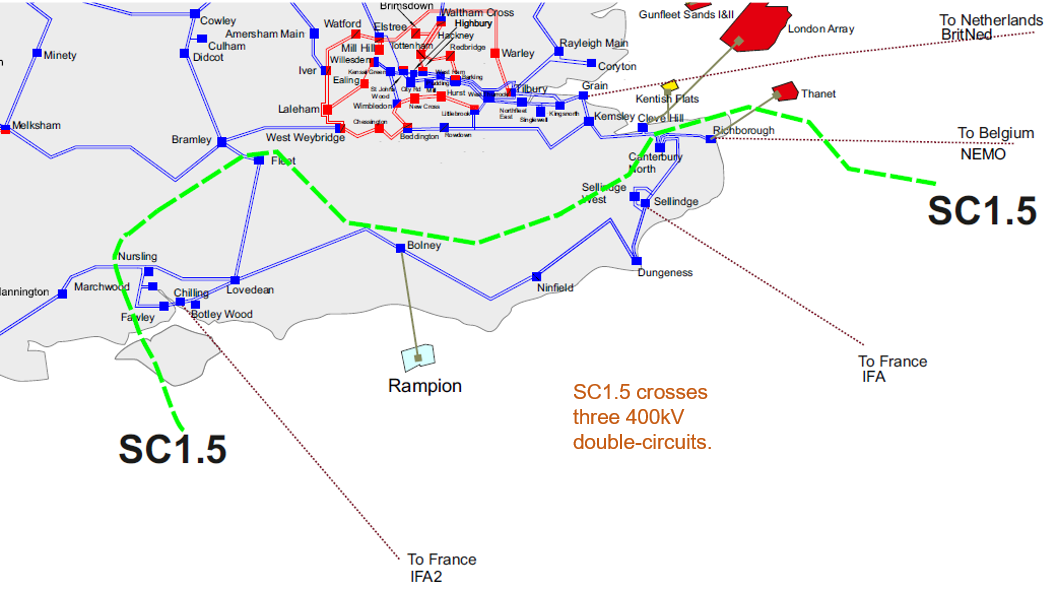
Boundary SC1.5 is between SC1 and SC2 to capture issues to the west of Nursling. The boundary crosses over the double circuits between Nursling–Mannington, Bramley–Fleet and Cleve Hill–Canterbury.
Boundary flows and base capability

View an interactive version of the graph
The capability line (in red) is based on the recommendations from the Beyond 2030 report, which uses the 2023 FES and ETYS data as inputs. The 50%, 90% Economy RT and Security RT lines are based on FES 2023. The ETYS and NOA methodologies for this boundary are different and can result in different transfer capabilities.
The boundary capability is limited to 5.56GW due to a thermal constraint on the Bramley–Fleet 400kV circuit.
At times of peak winter GB demand, the power flow is typically north to south across the boundary, with more demand enclosed in the south of the boundary than supporting generation.
Interconnector activity can significantly influence the boundary power flow. There is a new interconnector connecting at Chilling this boundary captures.
The interconnectors with Europe have a large impact on the power transfers across SC1.5 as a 2.0GW interconnector can make 4.0GW of difference on the boundary if it moves from import to export.
The volatility of interconnector activity can be seen in the wide spread of expected boundary flows depicted by the central darker band. Transfers (shown above) do not place high loading on the interconnectors, so the transfers are not seen to peak at very high values.
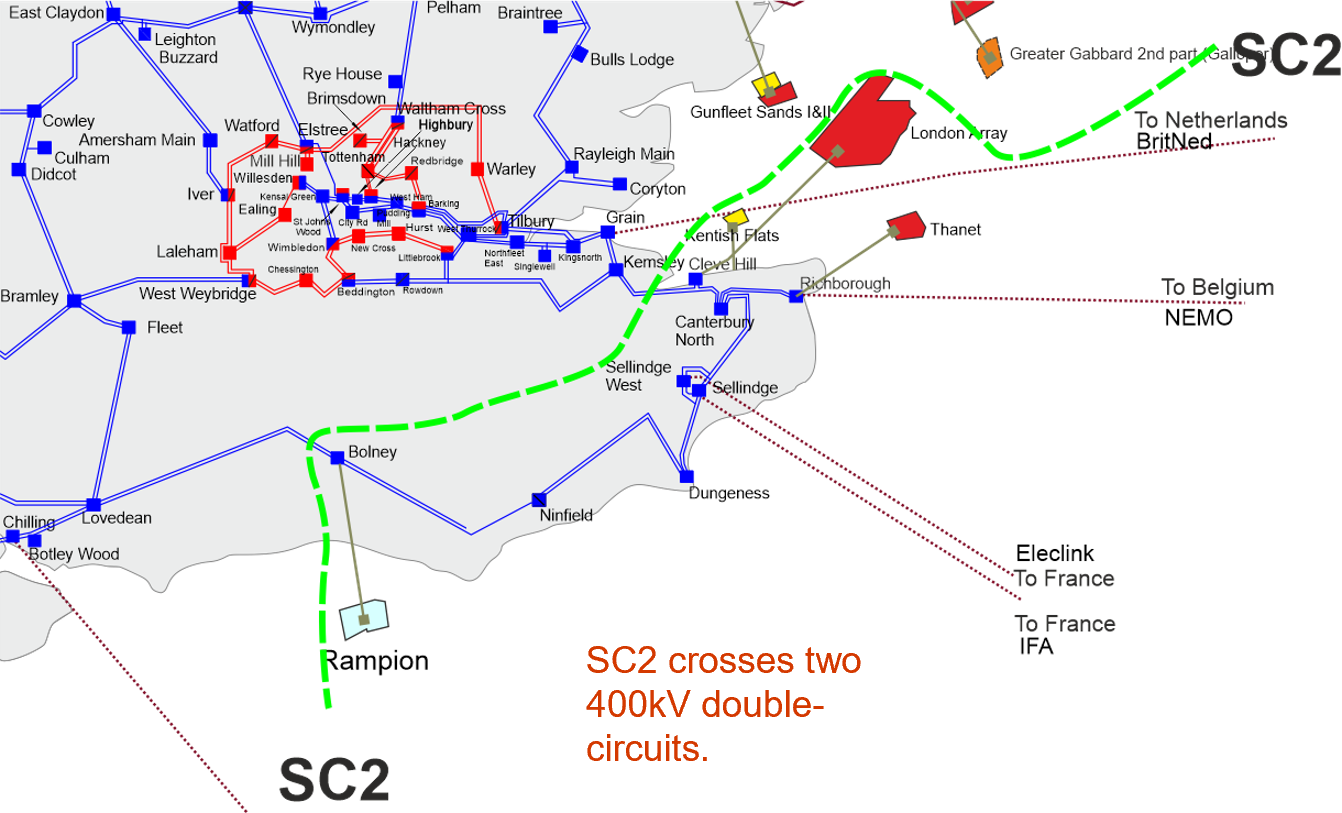
SC2 is a subset of the SC1 boundary created to capture transmission issues specifically in the south part of the network between Kemsley and Lovedean.
Boundary flows and base capability

View an interactive version of the graph
The capability line (in red) is based on the recommendations from the Beyond 2030 report, which uses the 2023 FES and ETYS data as inputs. The 50%, 90% Economy RT and Security RT lines are based on FES 2023. The ETYS and NOA methodologies for this boundary are different and can result in different transfer capabilities.
The boundary capability is limited to 3.75GW due to voltage compliance constraints.
The relatively long 400kV route between Kemsley and Lovedean feeds significant demand and connects both large generators and interconnection to Europe. A fault at either end of the route can cause it to become a long radial feeder, which puts all loading on the remaining two circuits. This can be restrictive due to circuit ratings and can cause voltage issues.
Additional generation and interconnectors are contracted for connection below SC2, which can place additional burden on the region.
The interconnectors with Europe have a large impact on the power transfers across SC2 as a 2.0GW interconnector can make 4.0GW of difference on the boundary if it moves from import to export. The volatility of interconnector activity can be seen in the wide spread of expected boundary flows depicted by the central darker band, similar to SC1.5. Transfers do not place high loading on the interconnectors, so the transfers are not seen to peak at very high values here either.
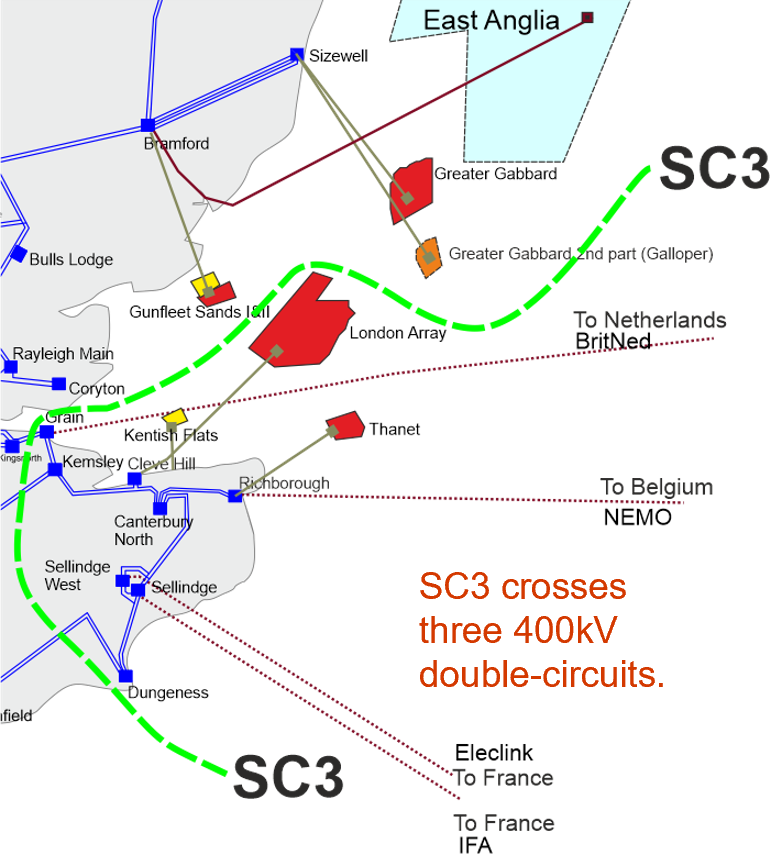
Boundary SC3 is created to capture transmission issues specifically in the south-east part of the network.
Boundary flows and base capability

View an interactive version of the graph
The capability line (in red) is based on the recommendations from the Beyond 2030 report, which uses the 2023 FES and ETYS data as inputs. The 50%, 90% Economy RT and Security RT lines are based on FES 2023. The ETYS and NOA methodologies for this boundary are different and can result in different transfer capabilities.
The boundary capability is limited to 6.7GW due to a thermal constraint on the Grain–Tilbury 400kV circuit.
The current and future interconnectors to Europe have a significant impact on the power transfers across SC3. The current interconnectors to France, the Netherlands, and Belgium connect at Sellindge, Grain, and Richborough respectively.
Across all four scenarios in the FES, the SQSS security required transfer follows similar patterns and is mainly lower compared to the economy required transfer. In general, the economy required transfer faces a decline over time, albeit it does not reflect the interconnectors uncertainties. The uncertainty of interconnector activity can be seen in the wide spread of the boundary flows depicted by the central darker band.
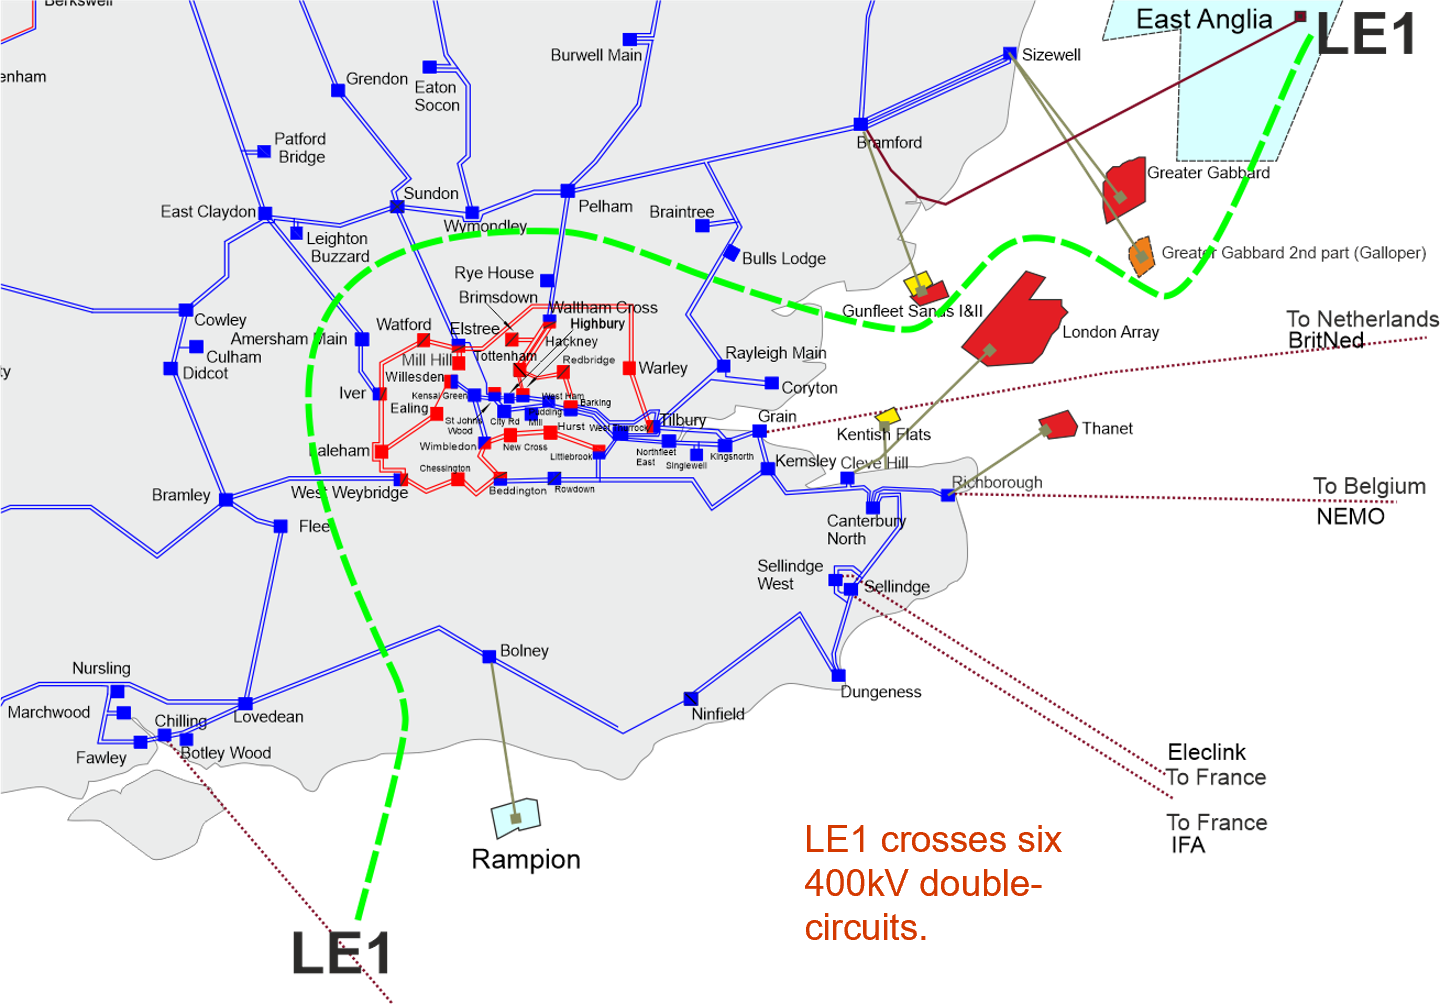
Boundary LE1 encompasses the south east of the UK, incorporating London and the areas to the south and east of it.
Boundary flows and base capability

View an interactive version of the graph
The capability line (in red) is based on the recommendations from the Beyond 2030 report, which uses the 2023 FES and ETYS data as inputs. The 50%, 90% Economy RT and Security RT lines are based on FES 2023. The ETYS and NOA methodologies for this boundary are different and can result in different transfer capabilities.
The boundary capability is limited to 9.6GW due to a thermal constraint on the Elstree–Sundon 400kV circuit.
LE1 is characterised by two distinct areas. Within London, there is high local demand and little generation. The remainder of the area contains both high demand and high levels of generation.
LE1 almost exclusively imports power from the north and west into the south-east, and the purpose of the boundary is to monitor flows in this direction. With the existing and proposed interconnectors importing power from the continent, power flows enter London from all directions, to the extent that flows across LE1 reduce and limited constraints are seen.
However, with an increased number of interconnectors, and (in some scenarios) increased likelihood of them exporting power in future years, LE1 can become a higher demand area, with any locally generated power feeding straight into the interconnectors. As such, the circuits entering LE1 from the north can become overloaded as power is drawn into and through London toward the south and east.
Across all four scenarios in the FES, the SQSS economy required transfer grows beyond existing boundary capability from 2023 and the expected power flows are less than the required transfer and the uncertainty of interconnector activity can be seen in the wide range of the boundary flows.
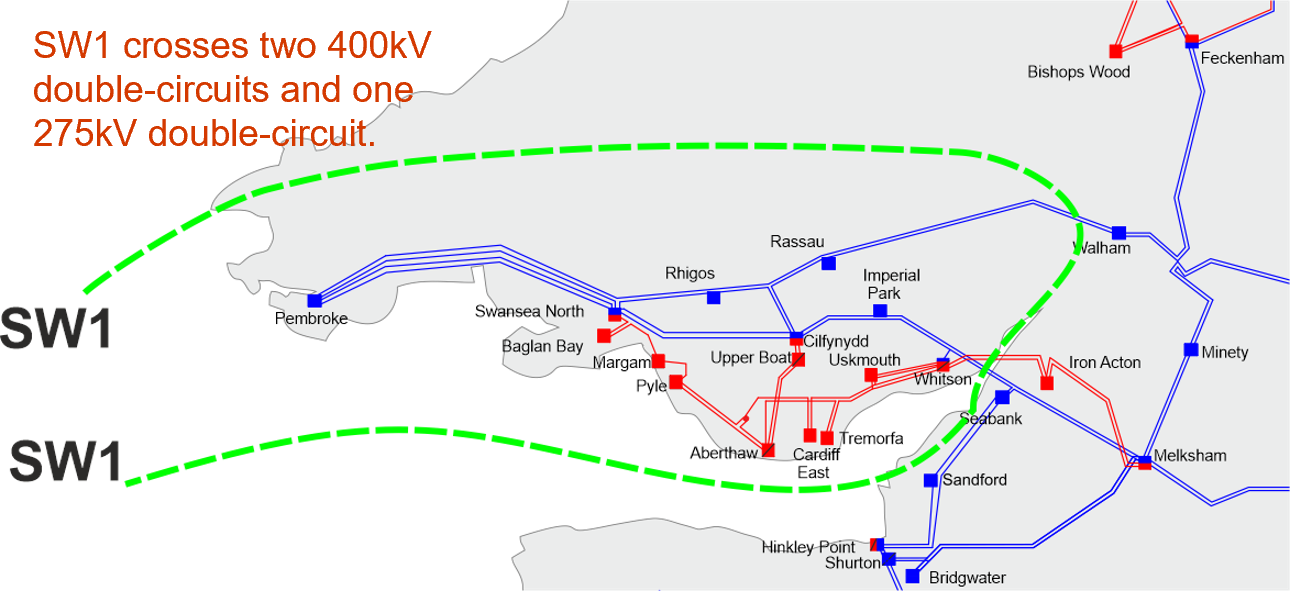
Boundary SW1 encloses South Wales and is considered a wider boundary.
Boundary flows and base capability

View an interactive version of the graph
The capability line (in red) is based on the recommendations from the Beyond 2030 report, which uses the 2023 FES and ETYS data as inputs. The 50%, 90% Economy RT and Security RT lines are based on FES 2023. The ETYS and NOA methodologies for this boundary are different and can result in different transfer capabilities.
The boundary capability is limited to 2.9GW due to a thermal constraint on the Imperial Park–Melksham circuits.
Contained within the boundary is a mixture of generation types including renewable generation and fossil fuel generation which are expected to close. South Wales includes demand consumptions from the major cities, including Swansea and Cardiff, and the surrounding industry.
The boundary requirements are well within the boundary’s present capability, and we expect this to remain the case for the foreseeable future, as seen in the boundary chart.