

North of England boundaries
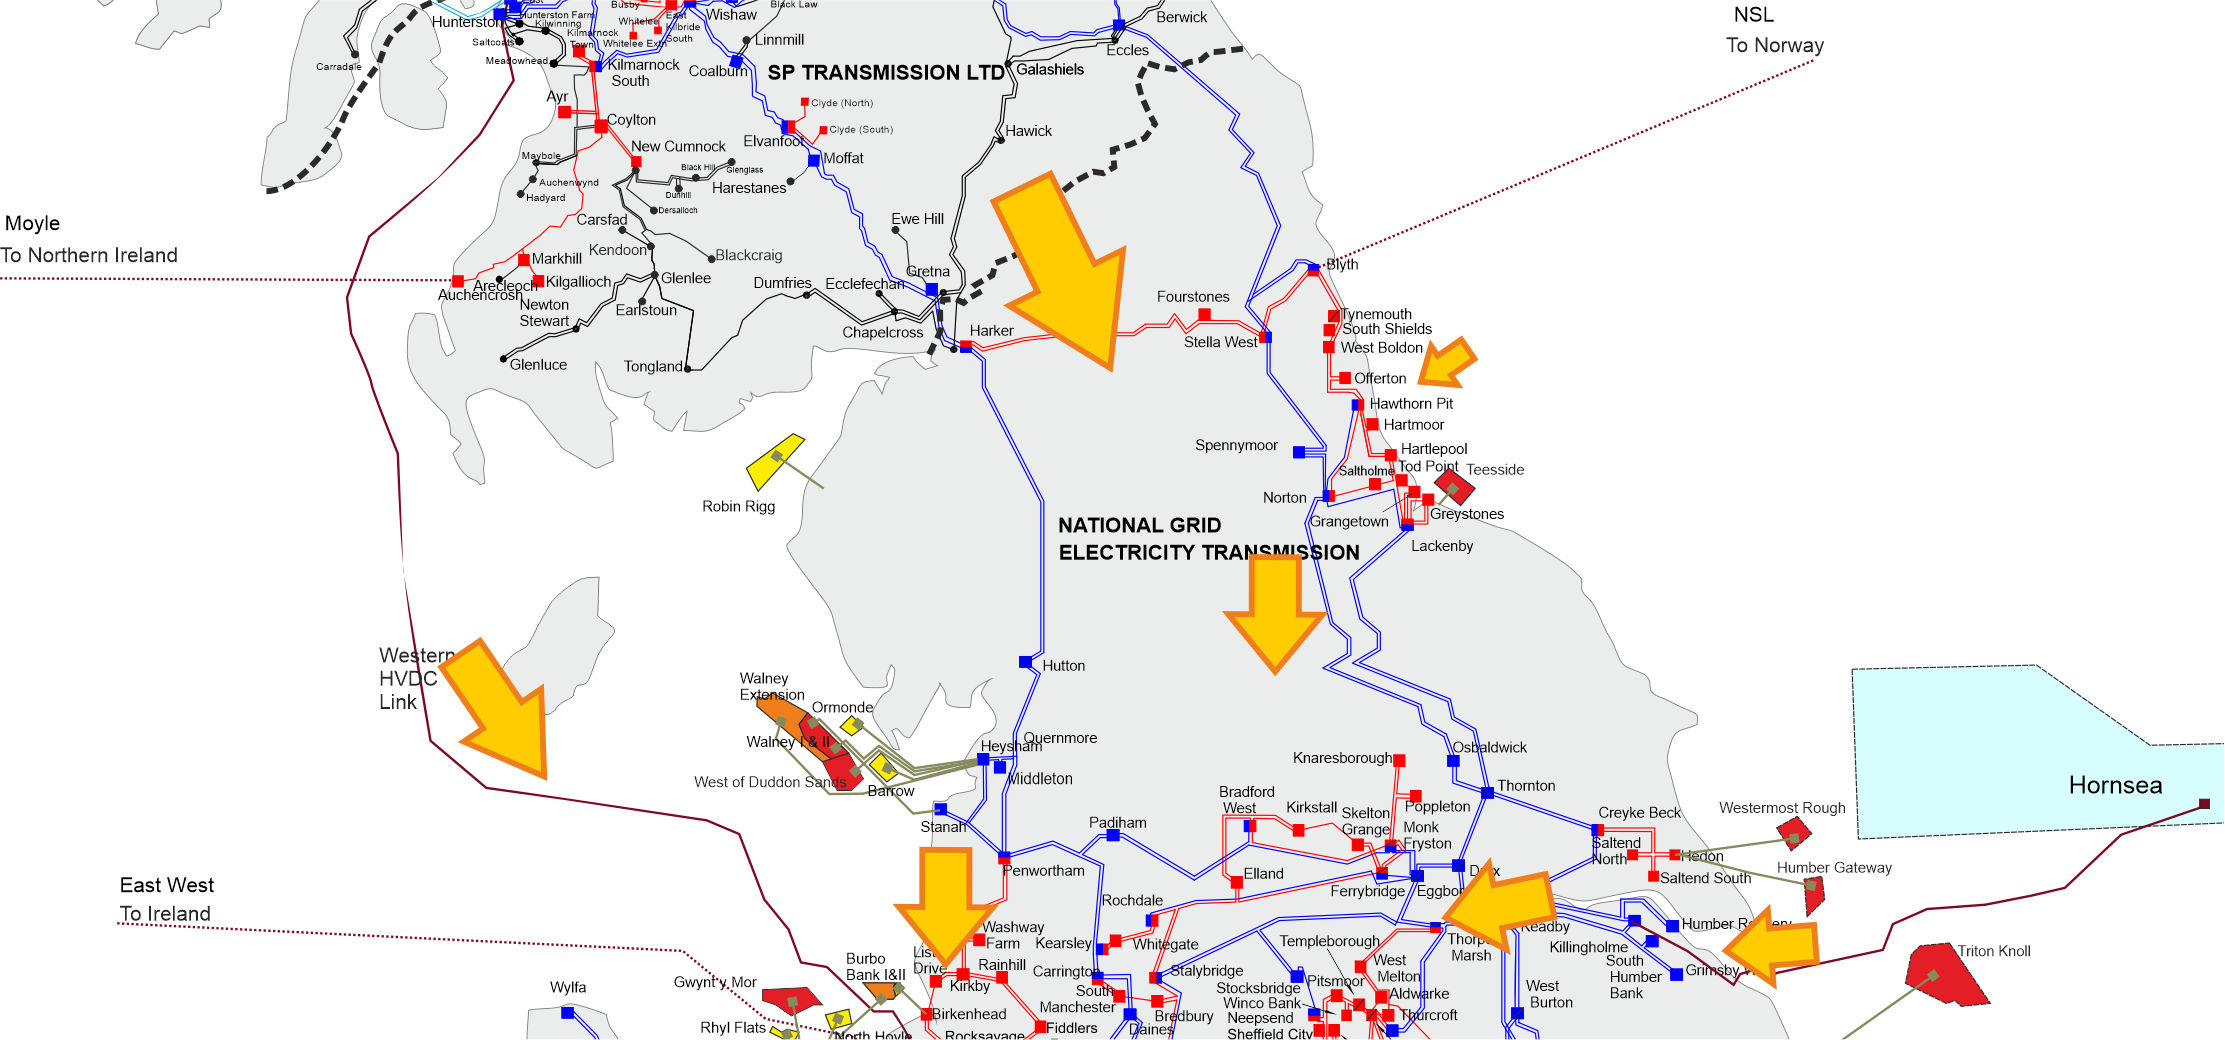
The north of England transmission region includes the transmission network between the Scottish border and the north Midlands. This includes the upper north boundaries B7a and B8.
The map below shows the general pattern of power flow directions expected to occur most of the time in the years to come up to 2033, i.e. power will generally flow from north to south. The arrows in the diagram illustrate power flow directions and are approximately scaled relative to the winter peak flows.
Regional thermal drivers – North of England
Future power transfer requirements could be more than double compared to what they are today in some scenarios. The significant volume of new generation in Scotland, most of which is intermittent renewables, is a key driver for the requirements in the northern transmission network.
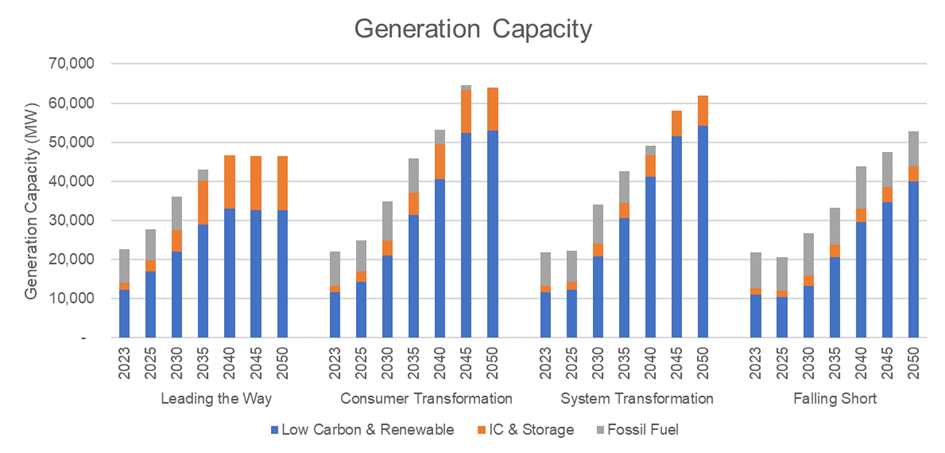
Low-carbon and renewable generation is expected to increase across all four scenarios. Fossil fuel generation could see sustained decline in all except the "Falling Short" scenario, but it wouldn’t be phased out in the region until 2040 at the earliest in the "Leading the Way" scenario.
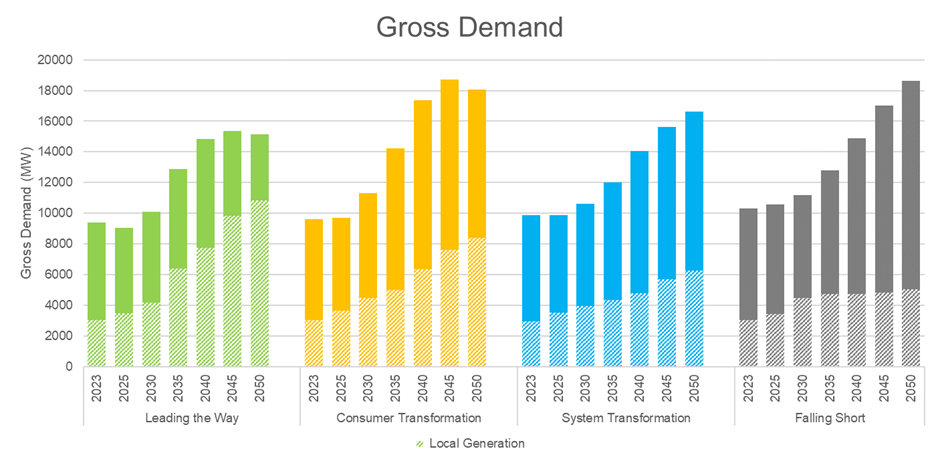
Overall, by 2030, the total generation in the region could increase to a total of over 36GW in the Leading the Way scenario. The north of England is a heavily power-exporting region and must also manage power flows from Scotland to demand centres in the Midlands and south England. Gross demand in north England is expected to increase to a total of over 11GW by 2030. All four scenarios show a steady increase in the gross demand of the region that outstrips the increase in local generation for all but the "Leading the Way" scenario. There are stark differences seen in the range of local generation under the four scenarios, a further 2.5–8GW is expected by 2050, up from about 3GW today. More local generation would result in less of the north-south power flows that travel through this region being absorbed by demand.
Presently, most of the northern transmission network is oriented for north-south power flows with connections for demand and generation along the way. At times of high wind generation, the power flow will travel north to south and mostly come from internal boundary generation and generators in Scotland. When most of this area and Scotland is generating power, the transmission network can be highly overloaded. The loss of one of the north to south routes can have a highly undesirable impact on the remaining circuits.
The need for any new network reinforcement to address potential capability limitations will be evaluated in the upcoming TCSNP2 following input from Transmission Owners and other interested stakeholders. Following the evaluation, recommendations on reinforcements for the North of England region will be published.
Regional voltage drivers – North of England
We could see both generation closures as well as some new generation connections in the North of England. The timing of these closures or connections could result in some system needs for certain years.
High voltage in this region arises due to the high gain cable circuits and a decline in reactive power demands. Low voltages are sometimes observed in the North East region during outages and high active power flows from Scotland and interconnector imports.
Solutions procured through the Pennine Pathfinder 2024 and Stability Pathfinder Phase 3 will help support the voltage in this region when implemented. We expect two synchronous compensators from 2025 and one from 2026 in this region as part of Stability Pathfinder Phase 3 project.
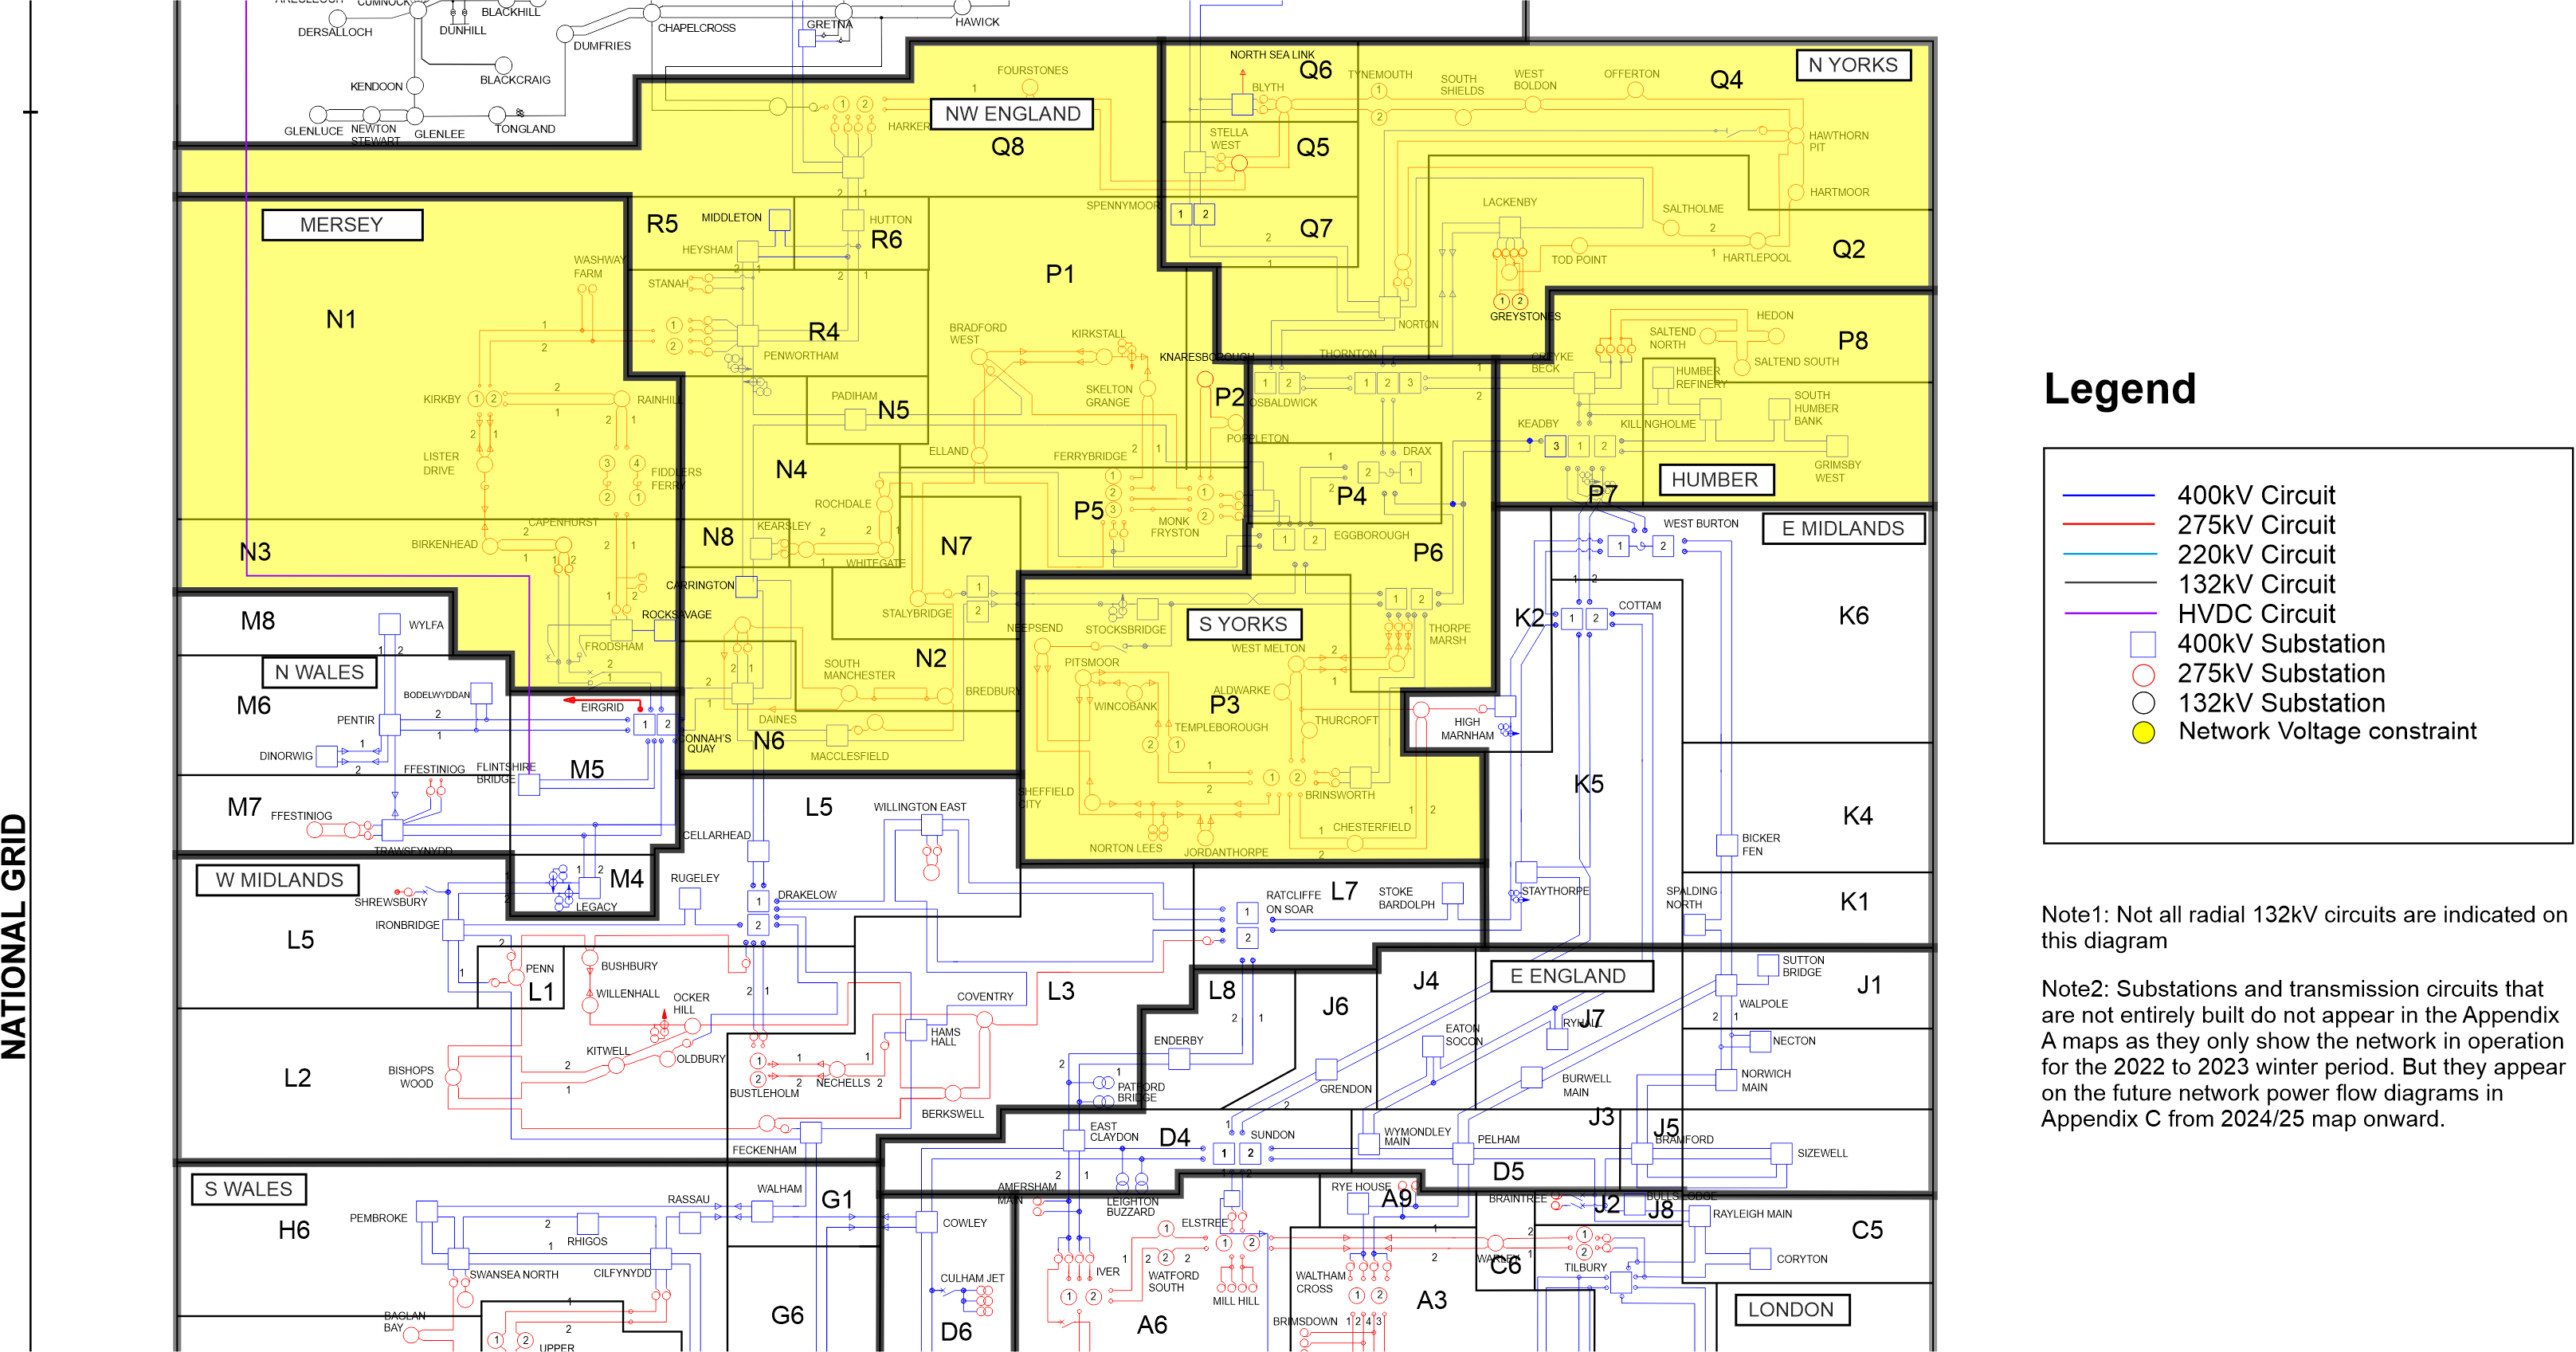
The map below shows Mersey, North West England, South Yorkshire, and North Yorkshire and the Humber identified through our voltage screening process.
Download a larger version of this image
Boundary Regions
Click on the regions below to expand the boundary and understand its capability and challenges.
The graphs show a distribution of power flows for each of our Future Energy Scenarios, in addition to the boundary power transfer capability and NETS SQSS requirements for the next 20 years.
Each scenario has different generation and demand so produces different boundary power flow expectations. From applying the methodology in the NETS SQSS for wider boundary planning requirements (as discussed in the previous chapter), we determine for each scenario:
- The economy criteria - solid coloured line
- Security criteria - dashed coloured line
- Current and future NOA capability (where available) - solid red line
The capability line (red line) is based on the recommendations from the Beyond 2030 report. More information about the NOA methodology can be found here. The 50%, 90%, economy required transfer (RT) and Security RT are calculated from the 2023 FES and ETYS processes. Where the NOA transfer capability is not available, there is a red line that provides the transfer capability from ETYS 2022.
Note: Boundary capability line is affected by the generation and demand profiles within each FES background. Therefore, the graphs are provided for indicative purposes only and cannot be directly compared.
The calculations of the annual boundary flow are based on unconstrained market operation, meaning network restrictions are not applied. This way, the minimum cost generation output profile can be found. We can see where the expected future growing needs could be by looking at the power flows in comparison with boundary capability.

View an interactive version of the graph
On each graph, the two shaded areas provide confidence as to what the power flows would be across each boundary:
- The darker region shows 50% of the annual power flows
- The lighter region shows 90% of the annual power flows
From the regions, we can show how often the power flows expected in the region split by the boundary are within its capability (red line). If the capability of the boundary is lower than the two regions over the next 20 years, there might be a need for reinforcements to increase the capability. However, if the line is above the shaded regions, it shows that there should be sufficient capability here and that potentially no reinforcements are needed from a free market power flow perspective until the shaded regions exceed the capability (red line).
Highlighted yellow areas on our NETS regional diagrams will show areas identified through our voltage screening process on the NETS that could face voltage needs over the next ten years. These areas have been identified through our annual voltage screening process outlined in our "About the ETYS" section and is included in our NOA methodology. These charts will be accompanied by a general commentary surrounding voltage behaviour in the regional area.
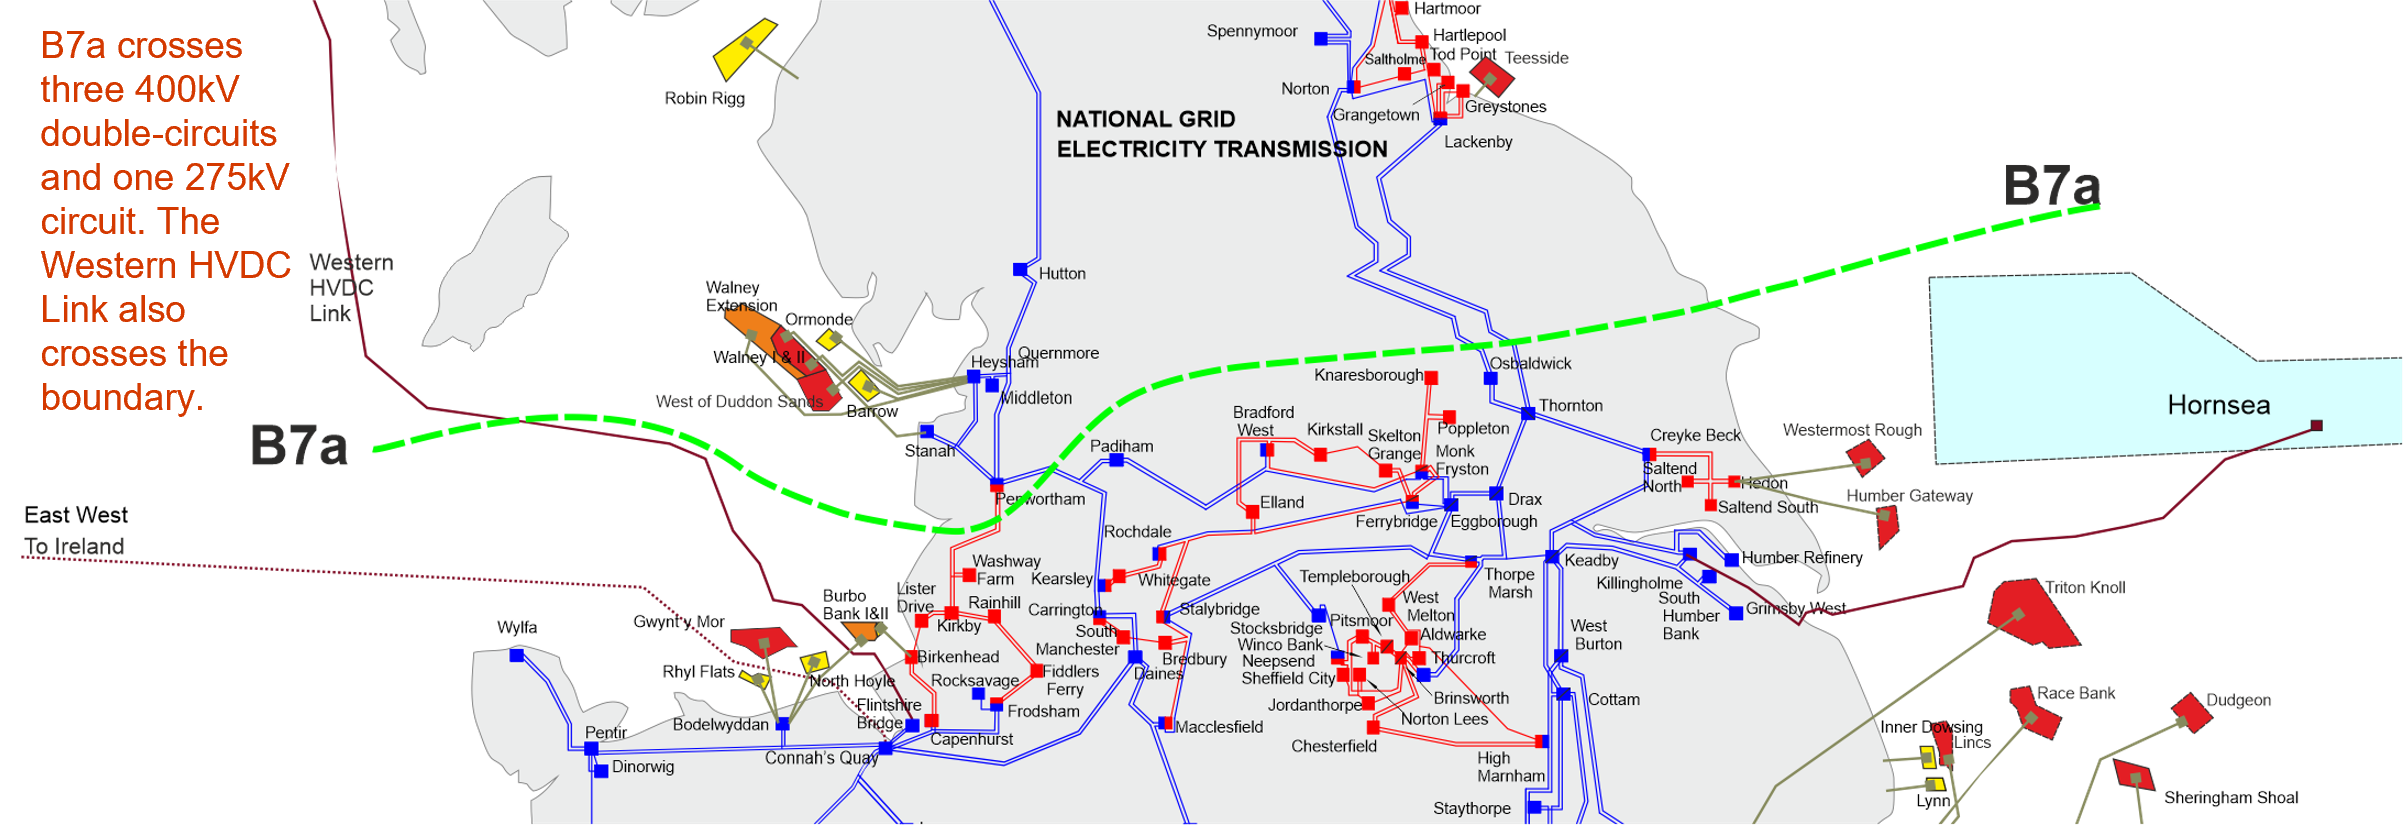
Boundary B7a bisects England south of Teesside and into the Mersey Ring area. It is used to capture network restrictions on the circuits feeding down through Liverpool, Manchester and Leeds.
Boundary flows and base capability

View an interactive version of the graph
The capability line (in red) is based on the recommendations from the Beyond 2030 report, which uses the 2023 FES and ETYS data as inputs. The 50%, 90% Economy RT and Security RT lines are based on FES 2023. The ETYS and NOA methodologies for this boundary are different and can result in different transfer capabilities.
The boundary capacity is limited to 9.4GW due to a thermal constraint on the Penwortham–Washway Farm 275kV circuit.
For all scenarios in the FES except "Falling Short," the SQSS economy required transfer and expected power flows quickly grow to beyond the present boundary capability. Falling Short will exceed this by 2027. This suggests a strong need for network development to manage the increasing power flows.
The FES show a lot of variable renewable generation in the north, meaning the spread of boundary power flows is very wide. With low northern generation output in it is credible to have power flowing from south to north feeding northern demand.
The magnitude of the south to north power flows is low compared to those in the opposite direction, so network capability should be sufficient to support those conditions.
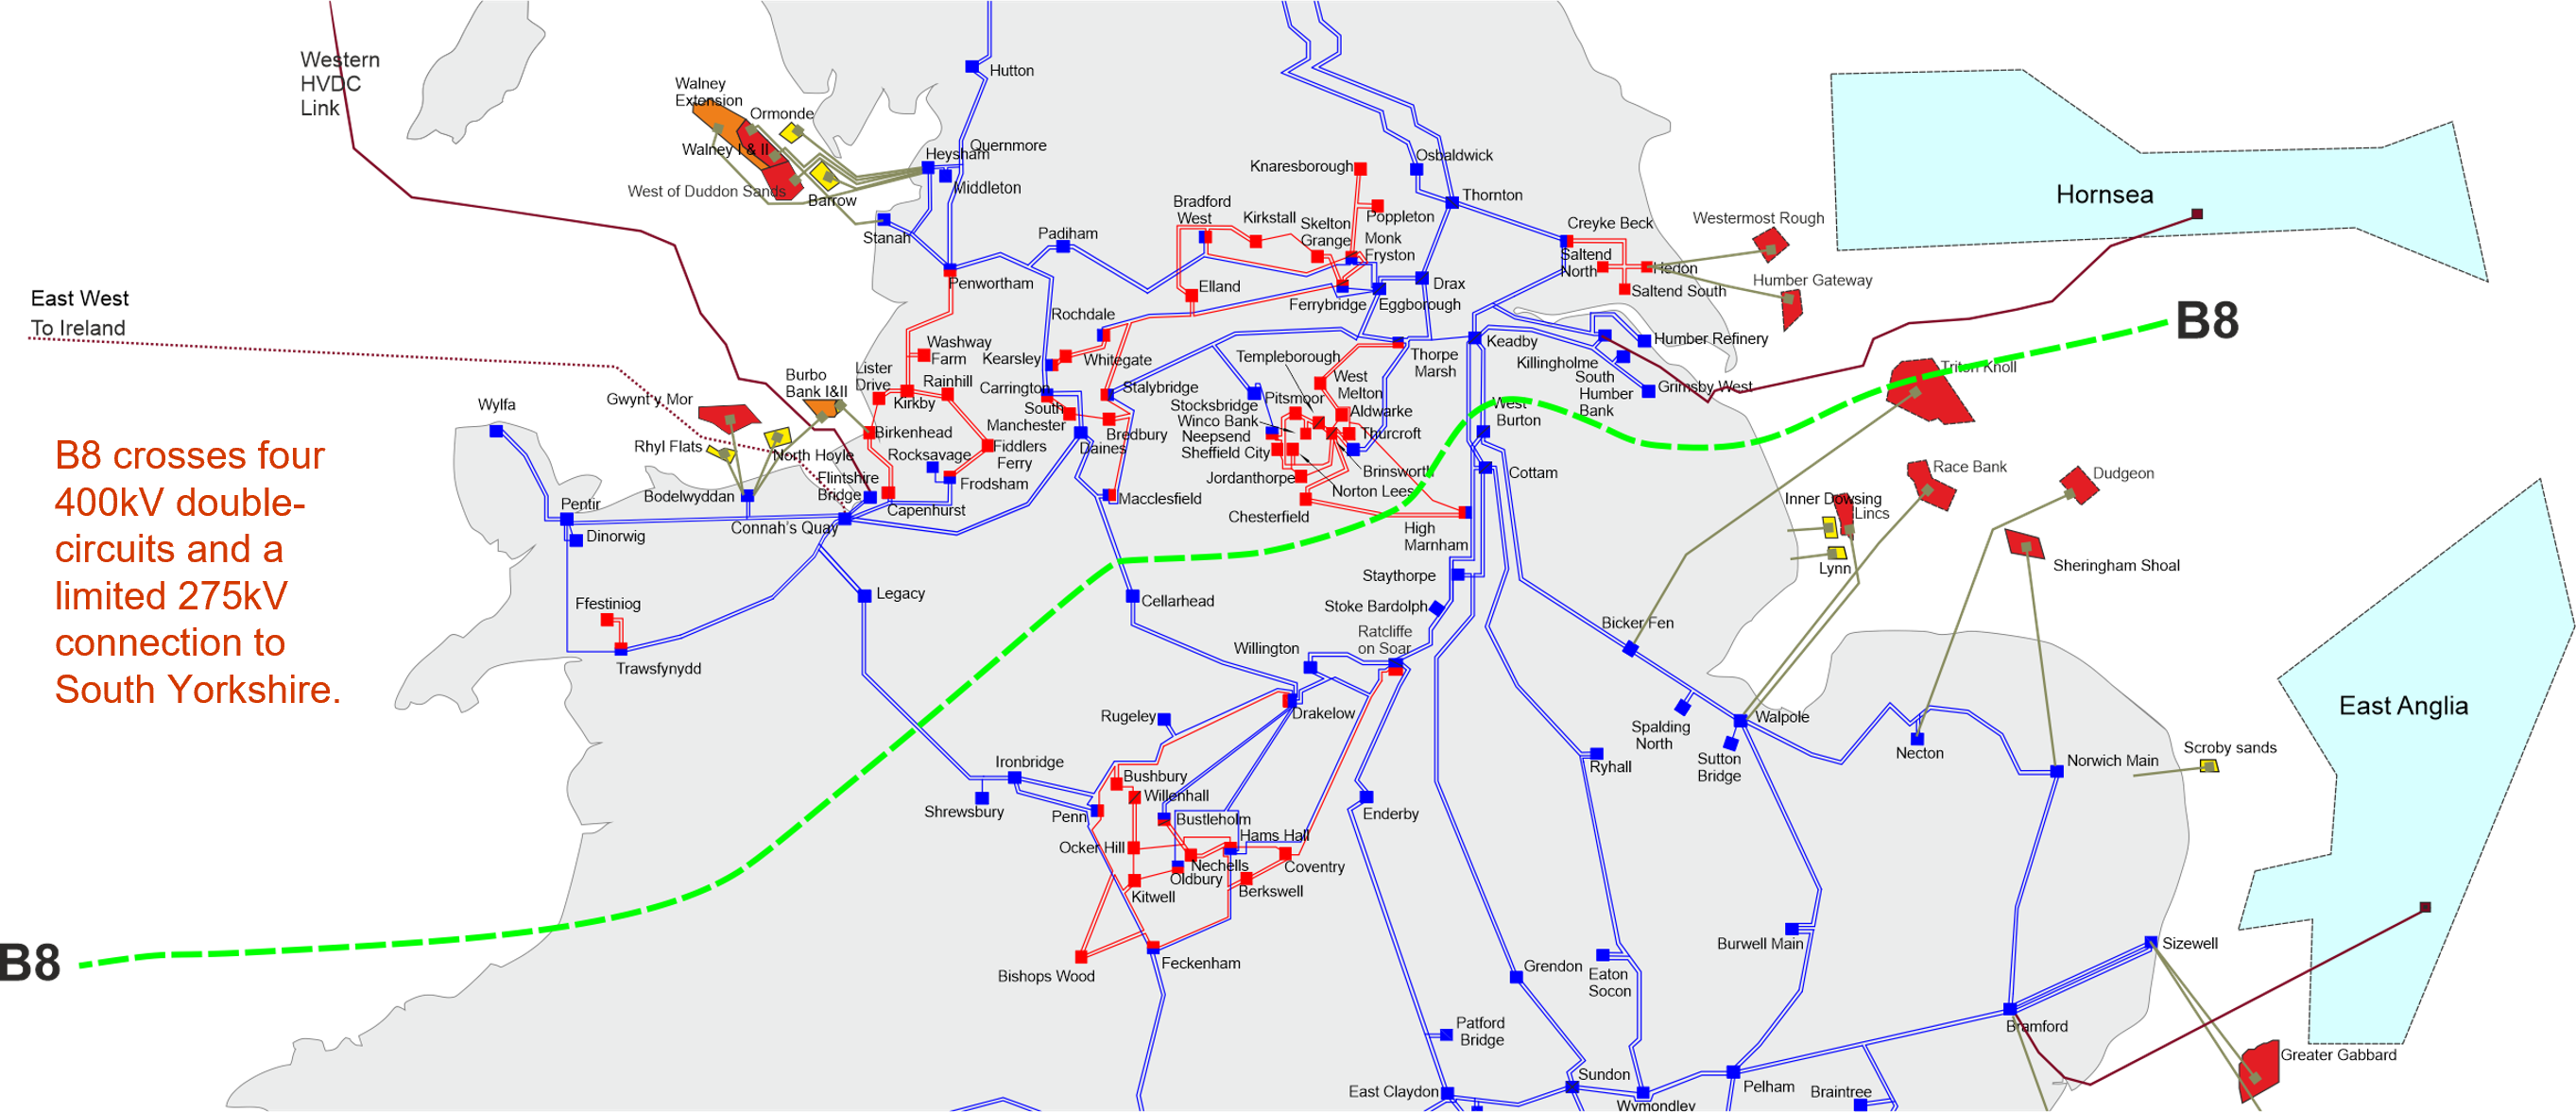
Boundary B8 is one of the wider boundaries that intersects the centre of GB, separating the northern generation zones including Scotland, Northern England and North Wales from the Midlands and southern demand centres.
Boundary flows and base capability

View an interactive version of the graph
The capability line (in red) is based on the recommendations from the Beyond 2030 report, which uses the 2023 FES and ETYS data as inputs. The 50%, 90% Economy RT and Security RT lines are based on FES 2023. The ETYS and NOA methodologies for this boundary are different and can result in different transfer capabilities.
The boundary capacity is limited to 11.6GW due to a thermal constraint on the Keadby–West Burton 400kV circuit.
For all scenarios in the FES, the SQSS economy required transfer and expected power flows quickly grow to beyond the present boundary capability. This suggests a strong need for network development to manage the increasing power flows.
The FES show a lot of variable renewable generation in the north, meaning the spread of boundary power flows is very wide. With low northern generation output in it is credible to have power flowing from south to north feeding northern demand.
The magnitude of the south to north power flows is low compared to those in the opposite direction so network capability should be sufficient to support those conditions.