

East of England boundaries
The East of England region includes the counties of Norfolk and Suffolk.
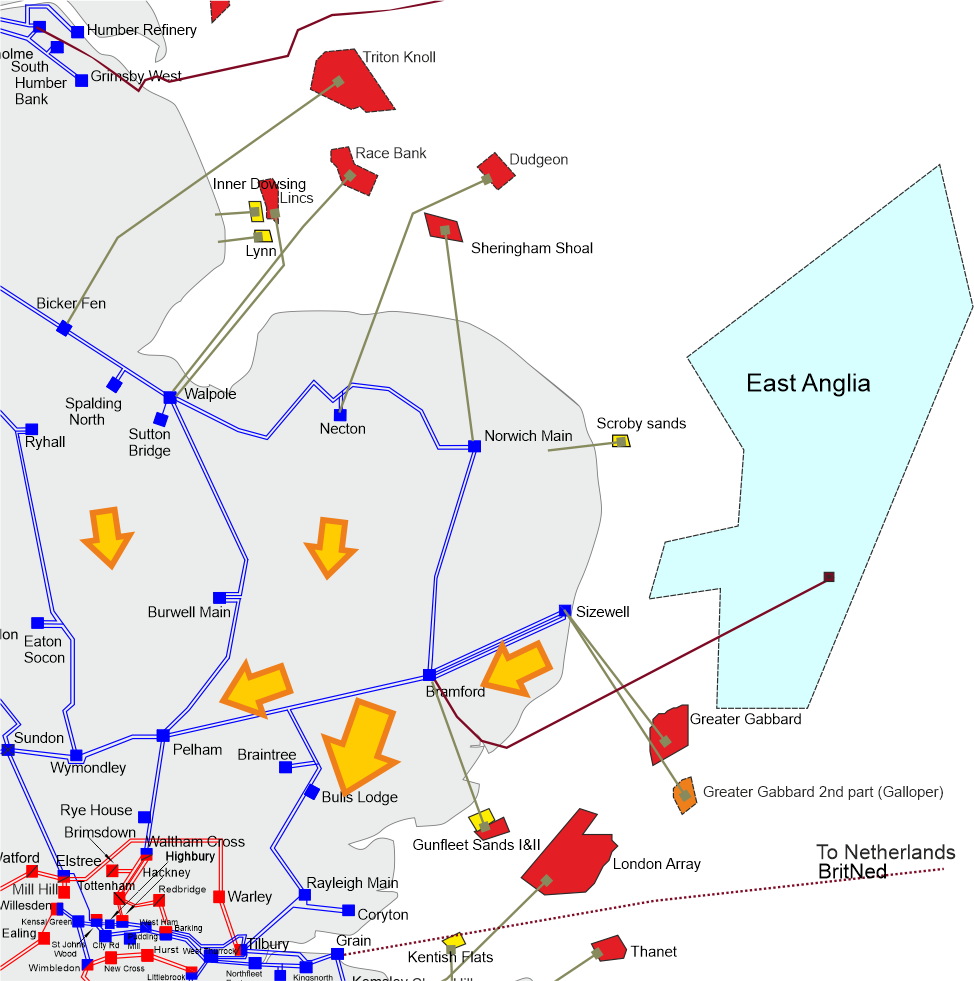
The map below shows the general pattern of power flow directions expected to occur most of the time in the years to come up to 2033, i.e. power will generally flow from north to south. The arrows in the diagram illustrate power flow directions and are approximately scaled relative to the winter peak flows.
Regional thermal drivers – East of England
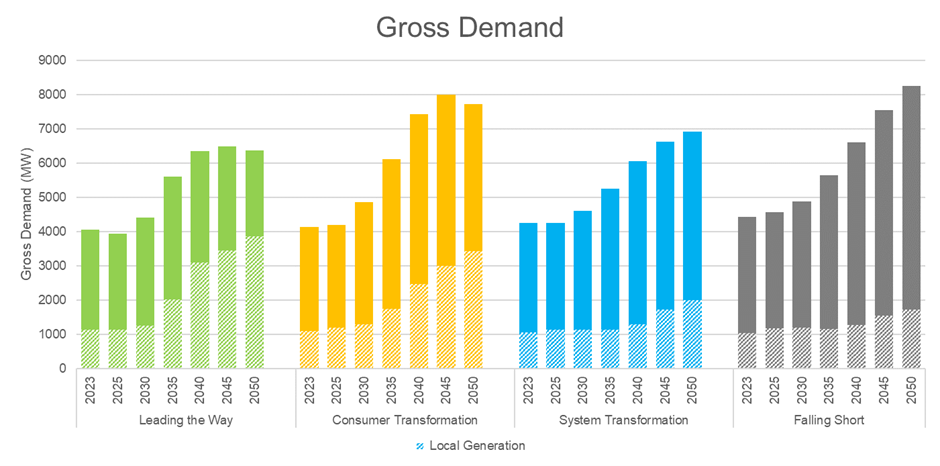
The Future Energy Scenarios highlight that growth in low-carbon and renewable generation will primarily drive the system needs in this region. Peak gross demand in the east of England region is expected to remain steady with limited growth over the same timeframe.
Over the next decade, this region could see growth in generation primarily from low carbon and renewable generation. From 2030, there could be further interconnector and storage connections in this region. Demand is steady in the short term with growth expected from 2030 out to 2050. As the total generation will likely exceed the local demand, this region will be a net power exporter.
There is work ongoing to coordinate the network infrastructure in this region to facilitate greater coordination of offshore generation and interconnectors connecting into this region. This includes the government's Offshore Coordination Support Scheme (OCSS), and the Holistic Network Design follow-up exercise led by the ESO.
In order to manage the constraints across the east coast boundaries, the ESO is also proactively developing a commercial non-build solution, the EC5 Constraint Management Intertrip Service (CMIS). This will contract with generators in the region to provide a more economical method of managing constraints than actions through the balancing mechanism. This follows the success of the CMIS now in operation across the B6 boundary.
As the ESO enters the next phase of our network planning cycle with the Transmission Owners and other interested parties (the TCSNP2), we will assess the need for network reinforcement or non-build solutions both within the region and GB-wide.

Regional voltage drivers – East of England
This region has seen increasing voltage control costs over the last few years, due to reliance on a limited choice of generation.
Over the next ten years, there could be some generation closures which could result in high voltage during low demand periods, which would be exacerbated during some outages or circuit trips in the area. Two synchronous compensators are planned from year 2025 and two more from 2026 in this region as part of Stability Pathfinder Phase 3 project.
In periods of high north to south flows, the east of England could experience low voltages, especially with generators on outage or restricted reactive capability. Also, with exporting south coast interconnectors and large power flows from north to south passing through East Anglia, voltage depression issues could occur in this region.
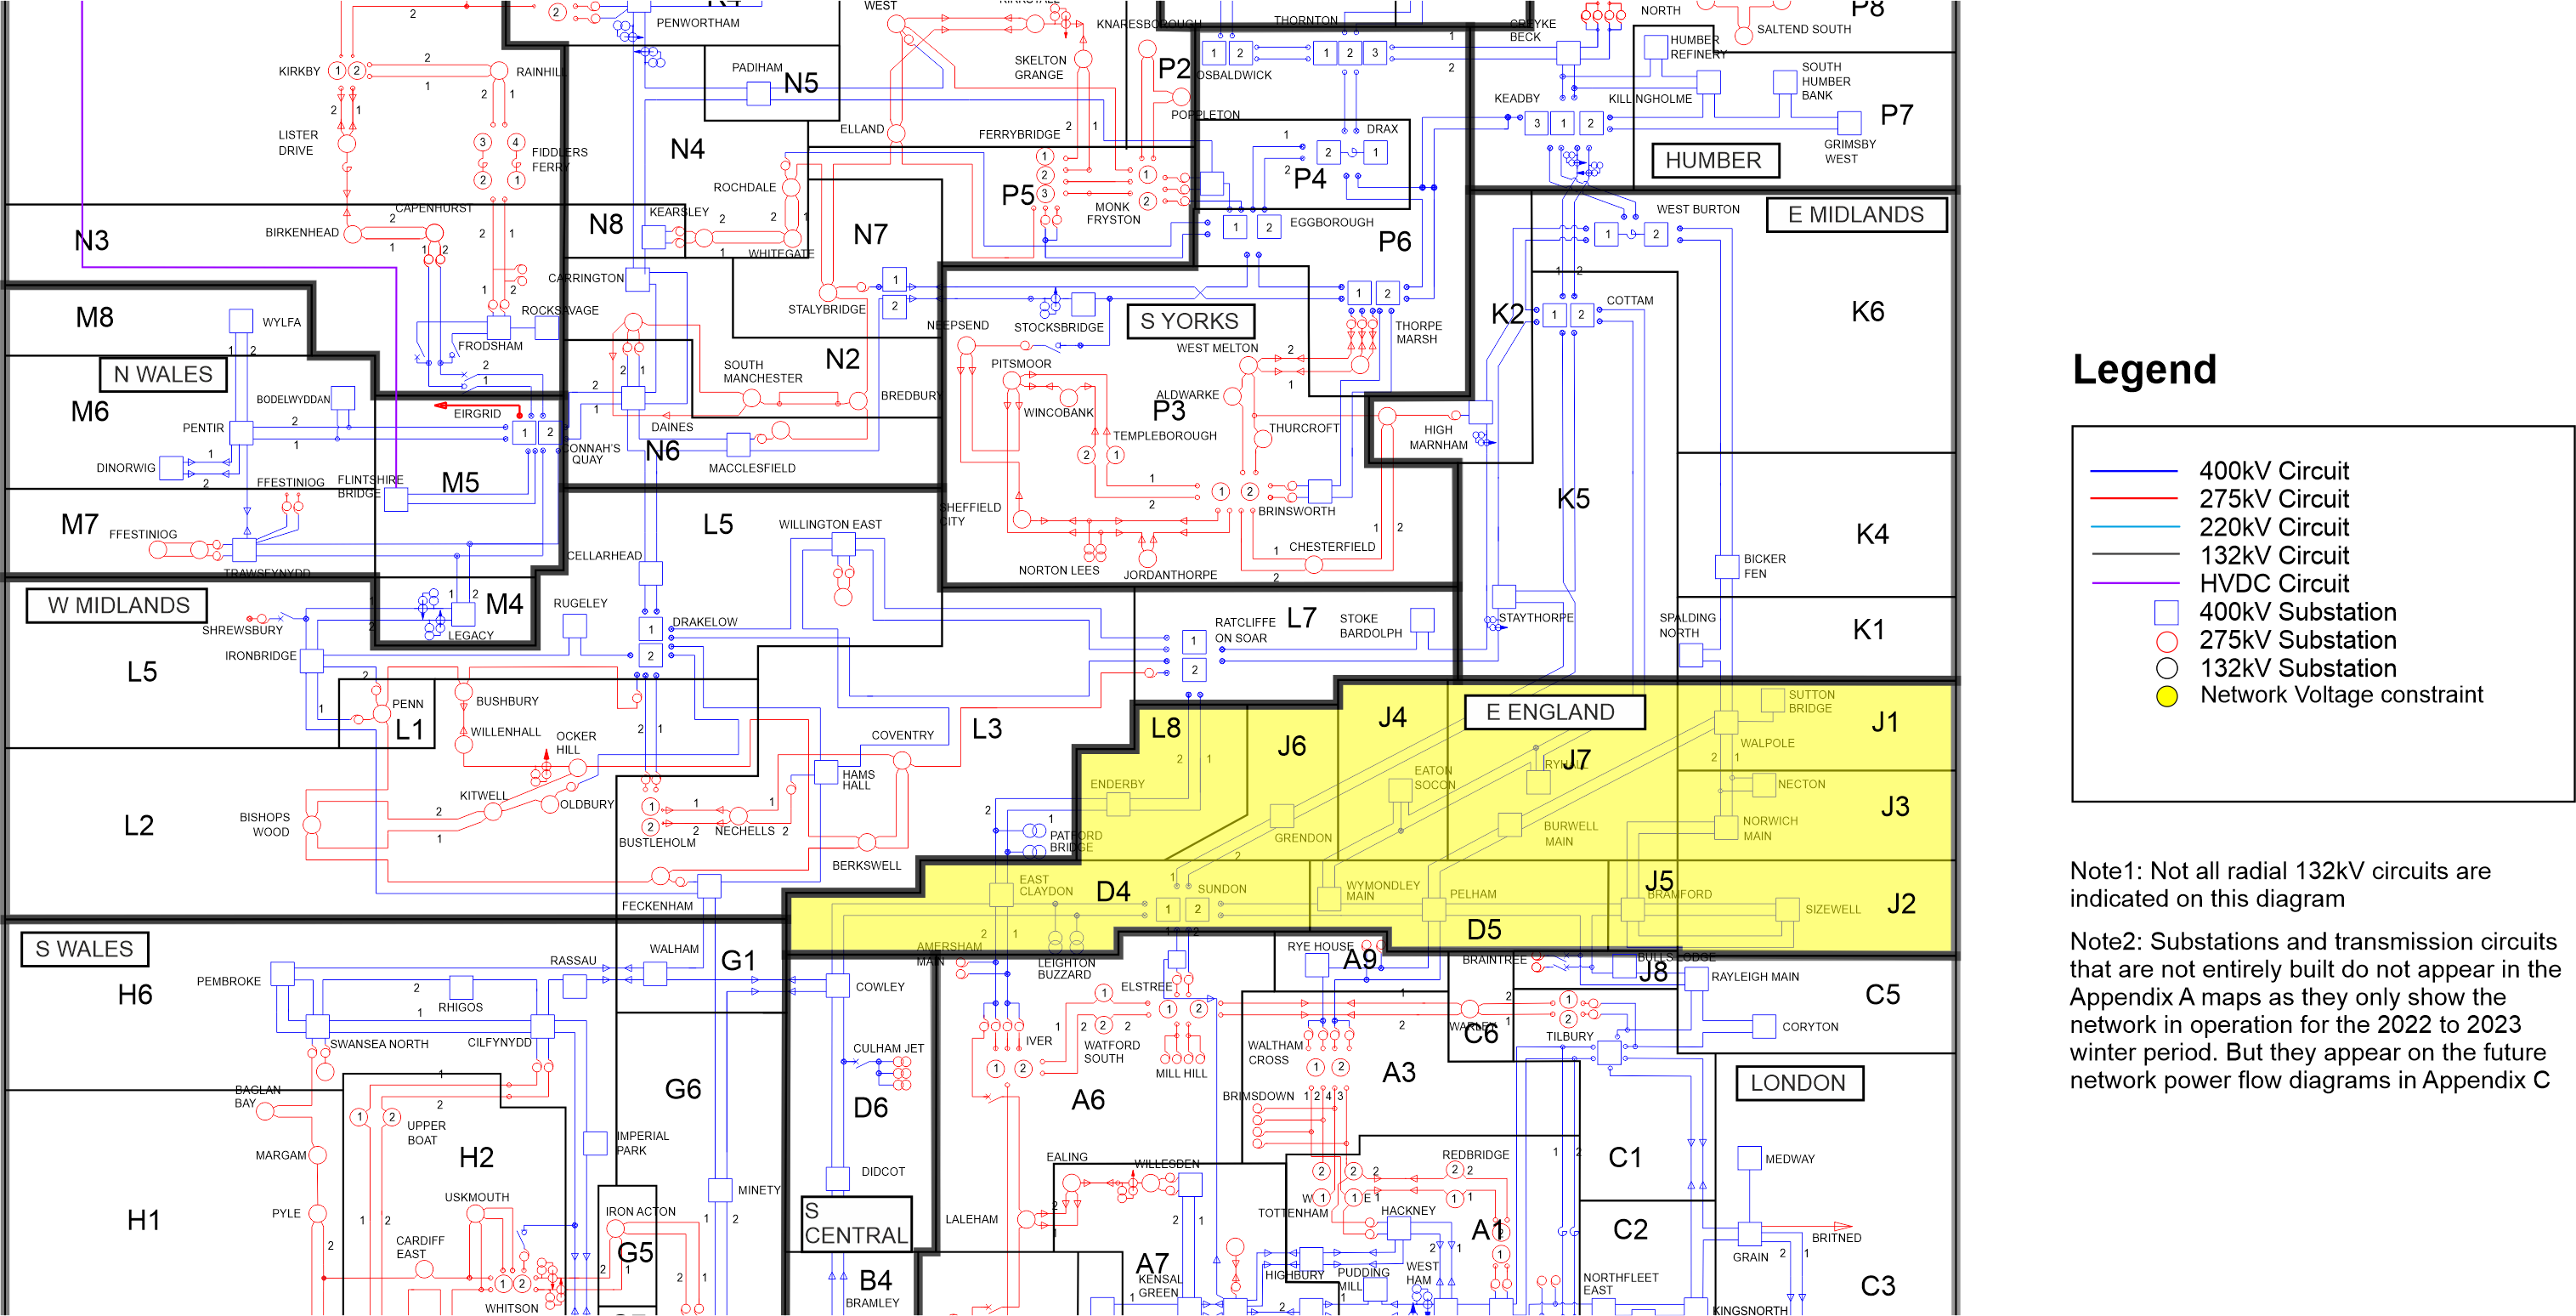
The map below shows the East of England identified through our voltage screening process.
Boundary regions
Click on the regions below to expand the boundary and understand its capability and challenges.
The graphs show a distribution of power flows for each of our Future Energy Scenarios, in addition to the boundary power transfer capability and NETS SQSS requirements for the next 20 years.
Each scenario has different generation and demand so produces different boundary power flow expectations. From applying the methodology in the NETS SQSS for wider boundary planning requirements (as discussed in the previous chapter), we determine for each scenario:
- The economy criteria - solid coloured line
- Security criteria - dashed coloured line
- Current and future NOA capability (where available) - solid red line
The capability line (red line) is based on the recommendations from the Beyond 2030 report. More information about the NOA methodology can be found here. The 50%, 90%, economy required transfer (RT) and Security RT are calculated from the 2023 FES and ETYS processes. Where the NOA transfer capability is not available, there is a red line that provides the transfer capability from ETYS 2022.
Note: Boundary capability line is affected by the generation and demand profiles within each FES background. Therefore, the graphs are provided for indicative purposes only and cannot be directly compared.
The calculations of the annual boundary flow are based on unconstrained market operation, meaning network restrictions are not applied. This way, the minimum cost generation output profile can be found. We can see where the expected future growing needs could be by looking at the power flows in comparison with boundary capability.

View an interactive version of the graph
On each graph, the two shaded areas provide confidence as to what the power flows would be across each boundary:
- The darker region shows 50% of the annual power flows
- The lighter region shows 90% of the annual power flows
From the regions, we can show how often the power flows expected in the region split by the boundary are within its capability (red line). If the capability of the boundary is lower than the two regions over the next 20 years, there might be a need for reinforcements to increase the capability. However, if the line is above the shaded regions, it shows that there should be sufficient capability here and that potentially no reinforcements are needed from a free market power flow perspective until the shaded regions exceed the capability (red line).
Highlighted yellow areas on our NETS regional diagrams will show areas identified through our voltage screening process on the NETS that could face voltage needs over the next ten years. These areas have been identified through our annual voltage screening process outlined in our "About the ETYS" section and is included in our NOA methodology. These charts will be accompanied by a general commentary surrounding voltage behaviour in the regional area.
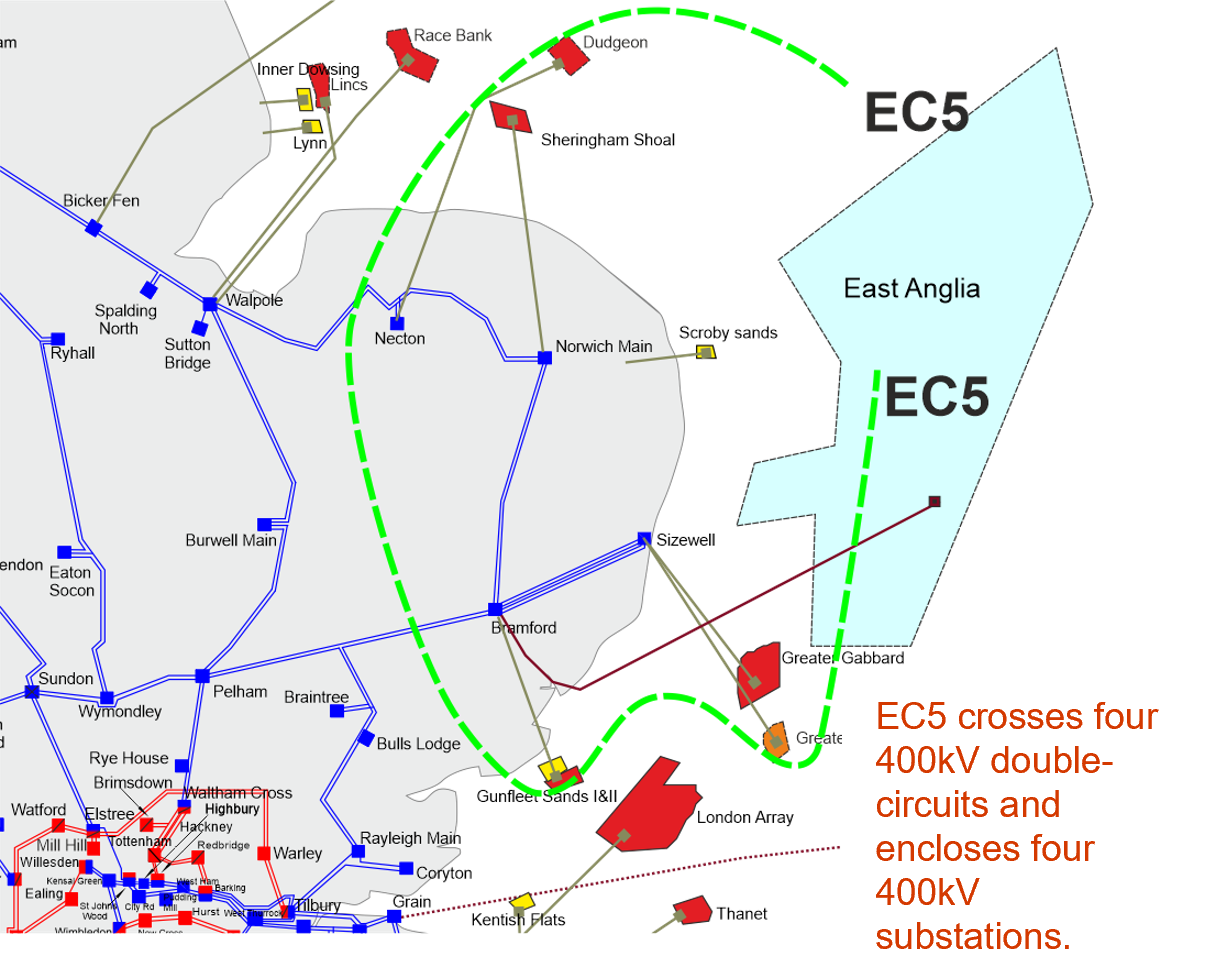
Download a larger version of the image
EC5 encloses the area around East Anglia.
Boundary flows and base capability

View an interactive version of the graph
The capability line (in red) is based on the recommendations from the Beyond 2030 report, which uses the 2023 FES and ETYS data as inputs. The 50%, 90% Economy RT and Security RT lines are based on FES 2023. The ETYS and NOA methodologies for this boundary are different and can result in different transfer capabilities.
The boundary capability is limited to 3.85GW due to a thermal constraint at the Bramford–Norwich Main double-circuit.
There are several offshore wind projects connecting into the region.
The growth in low carbon and renewable generation connecting behind this boundary greatly increase the power transfer requirements. The present boundary capability is sufficient for today’s needs but could be significantly short of the future capability requirements.
Work is ongoing to coordinate the network infrastructure in this region to facilitate greater coordination of generation connecting into this region.