
Our ETYS analysis
National Electricity Transmission System (NETS)
As the ESO, we are responsible for the system operation of the transmission networks in England, Wales, Scotland, and in the surrounding offshore waters.
The NETS is otherwise known as the Electricity Transmission network which spans across the Great Britain. The network comprises a mixture of overhead cables, underground cabling and subsea cables – the size of these assets varies from of 400kV, 275kV, and 132kV assets. These are all linked together via substations across the country that then connect separately owned generators, interconnectors, large demands, and distribution systems.
Electricity distribution comprises of networks below 275kV in England and Wales, and 132kV in Scotland, which transports electricity from transmission “highways” to the consumer.
Here, "transmission" generally means assets at 132kV or above in Scotland or offshore, but in some cases includes other lower voltage assets. In England and Wales, it relates mainly to assets at 275kV and above.
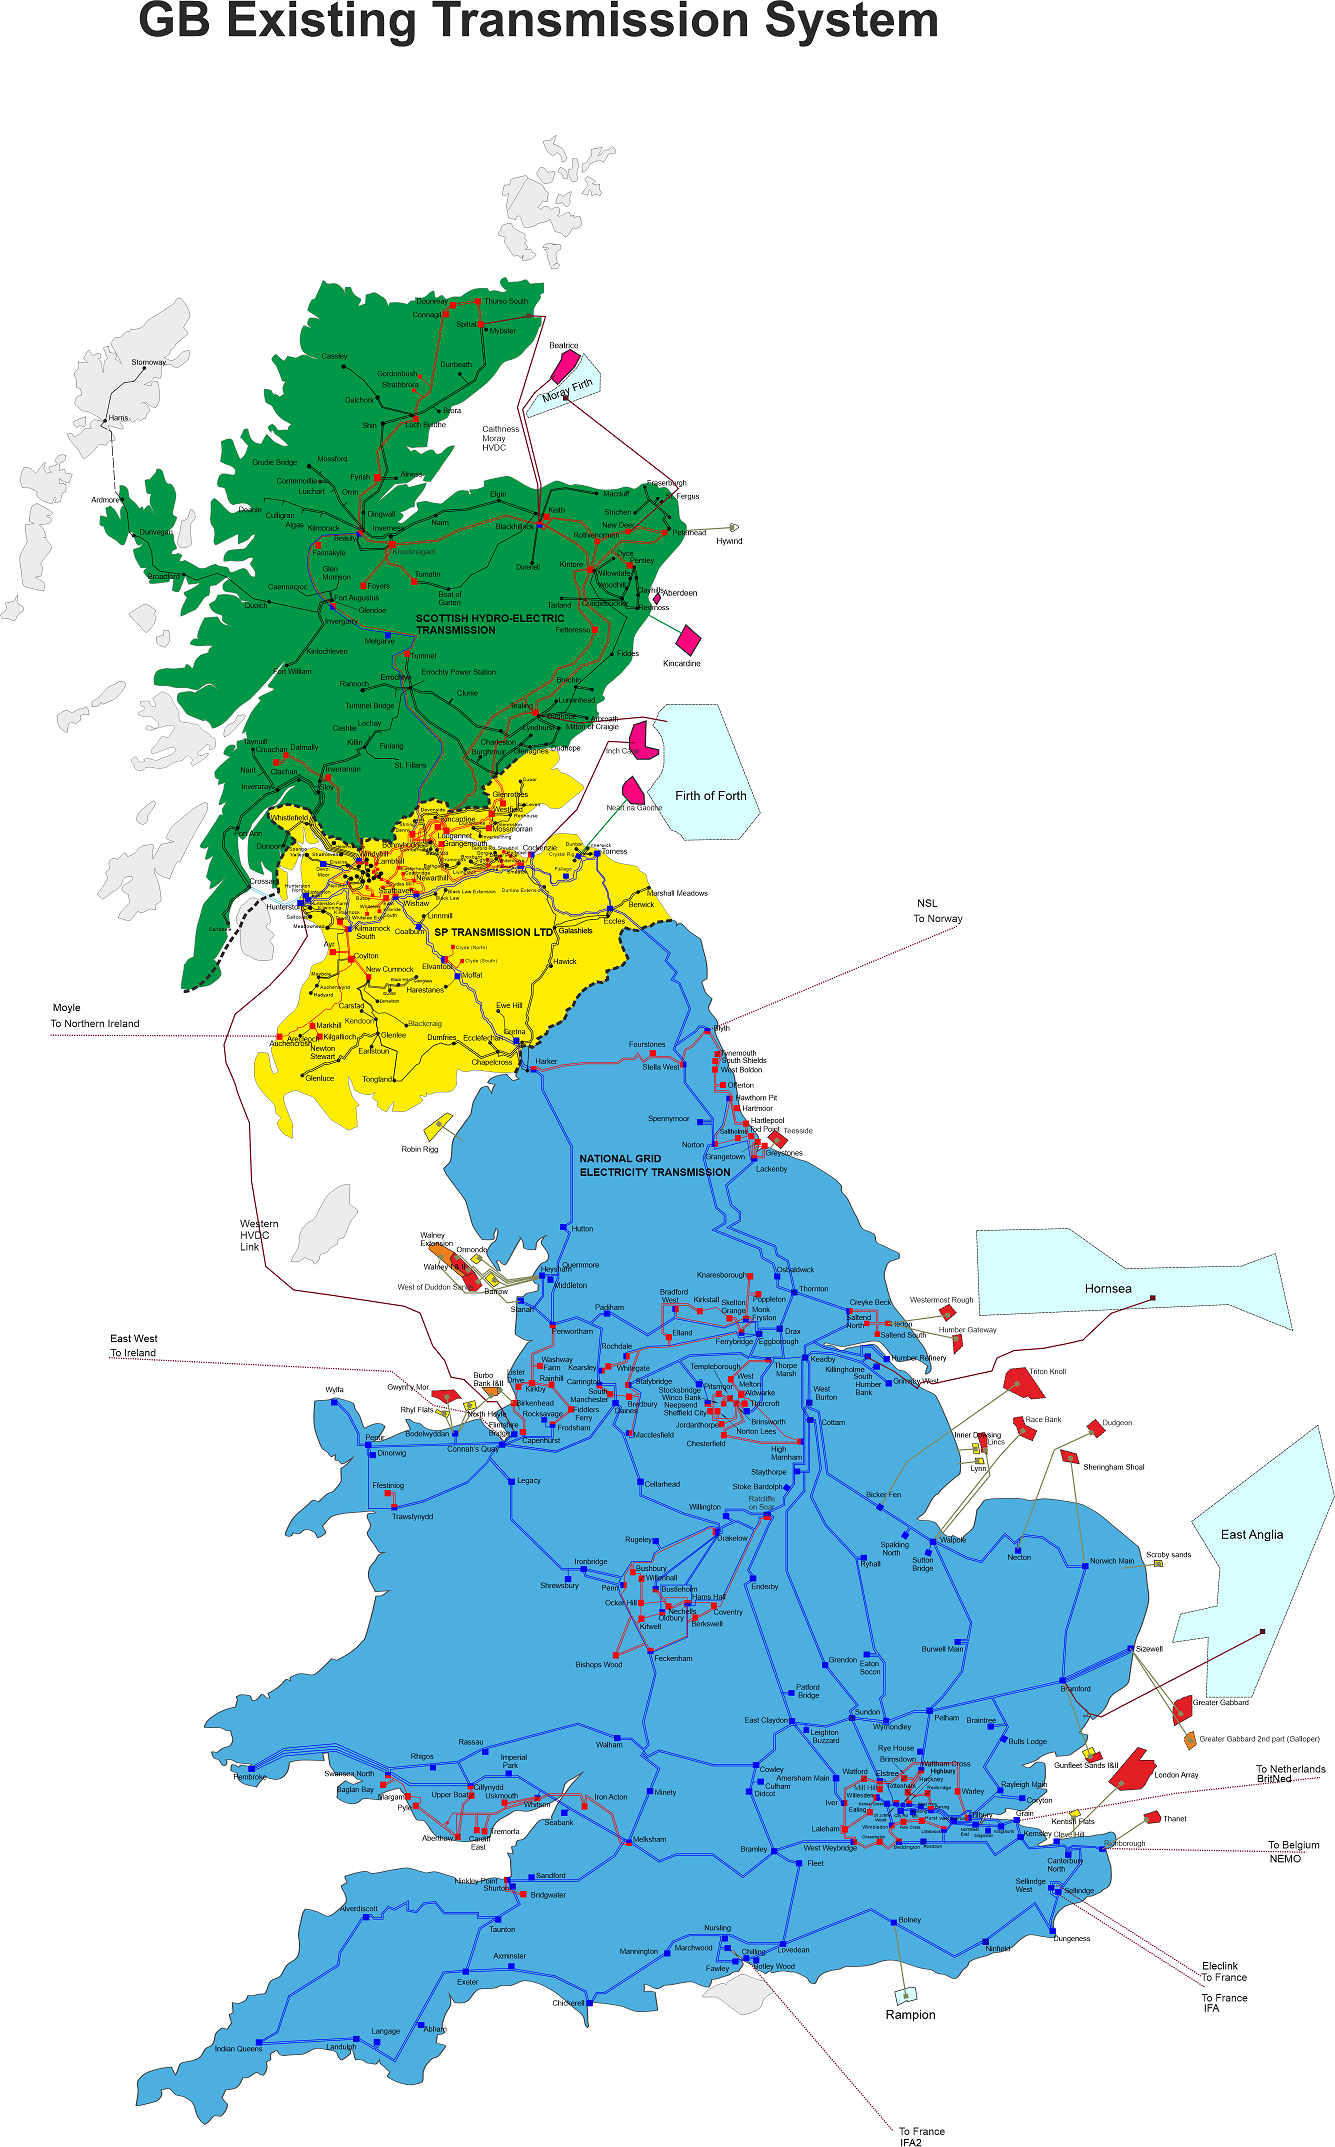
Great Britain has three onshore Transmission Owners that separately own the network. These are:
- Scottish Hydro Electric Transmission owns the network in the north of Scotland.
- Scottish Power Transmission owns the network in the south of Scotland.
- National Grid Electricity Transmission owns the transmission network in England and Wales.
There are also 24 licenced offshore transmission owners (OFTOs) appointed through Ofgem’s competitive tendering process. They own the assets that connect operational offshore wind farms to the transmission or distribution network.
Boundary analysis
Learn more about how we analyse the transmission network:
What is a boundary?
A boundary splits the system into two parts, crossing critical circuit paths that carry power between the areas where power flow limitations may be encountered.
Defining the boundaries has evolved over many years of planning and operating the transmission system. When significant changes occur, new boundaries may be defined and some boundaries either removed or amended and we communicate any changes with our stakeholders.
We do not study all boundaries, specifically those where no significant changes are identified in the FES generation and demand data compared to previous years. We assume the same capability as the previous year for these boundaries.
The boundaries used by ETYS can be split into two different types:
Local boundaries
Small areas of the NETS with a high concentration of generation. These small power export areas can give high probability of overloading the local transmission network due to too much generation operating simultaneously.
Wider boundaries
Boundary scaling methodologies assess the capability of the wider boundaries.
These consider both the geographical and technological effects of generation, allowing for a consistent capability and requirements assessment.
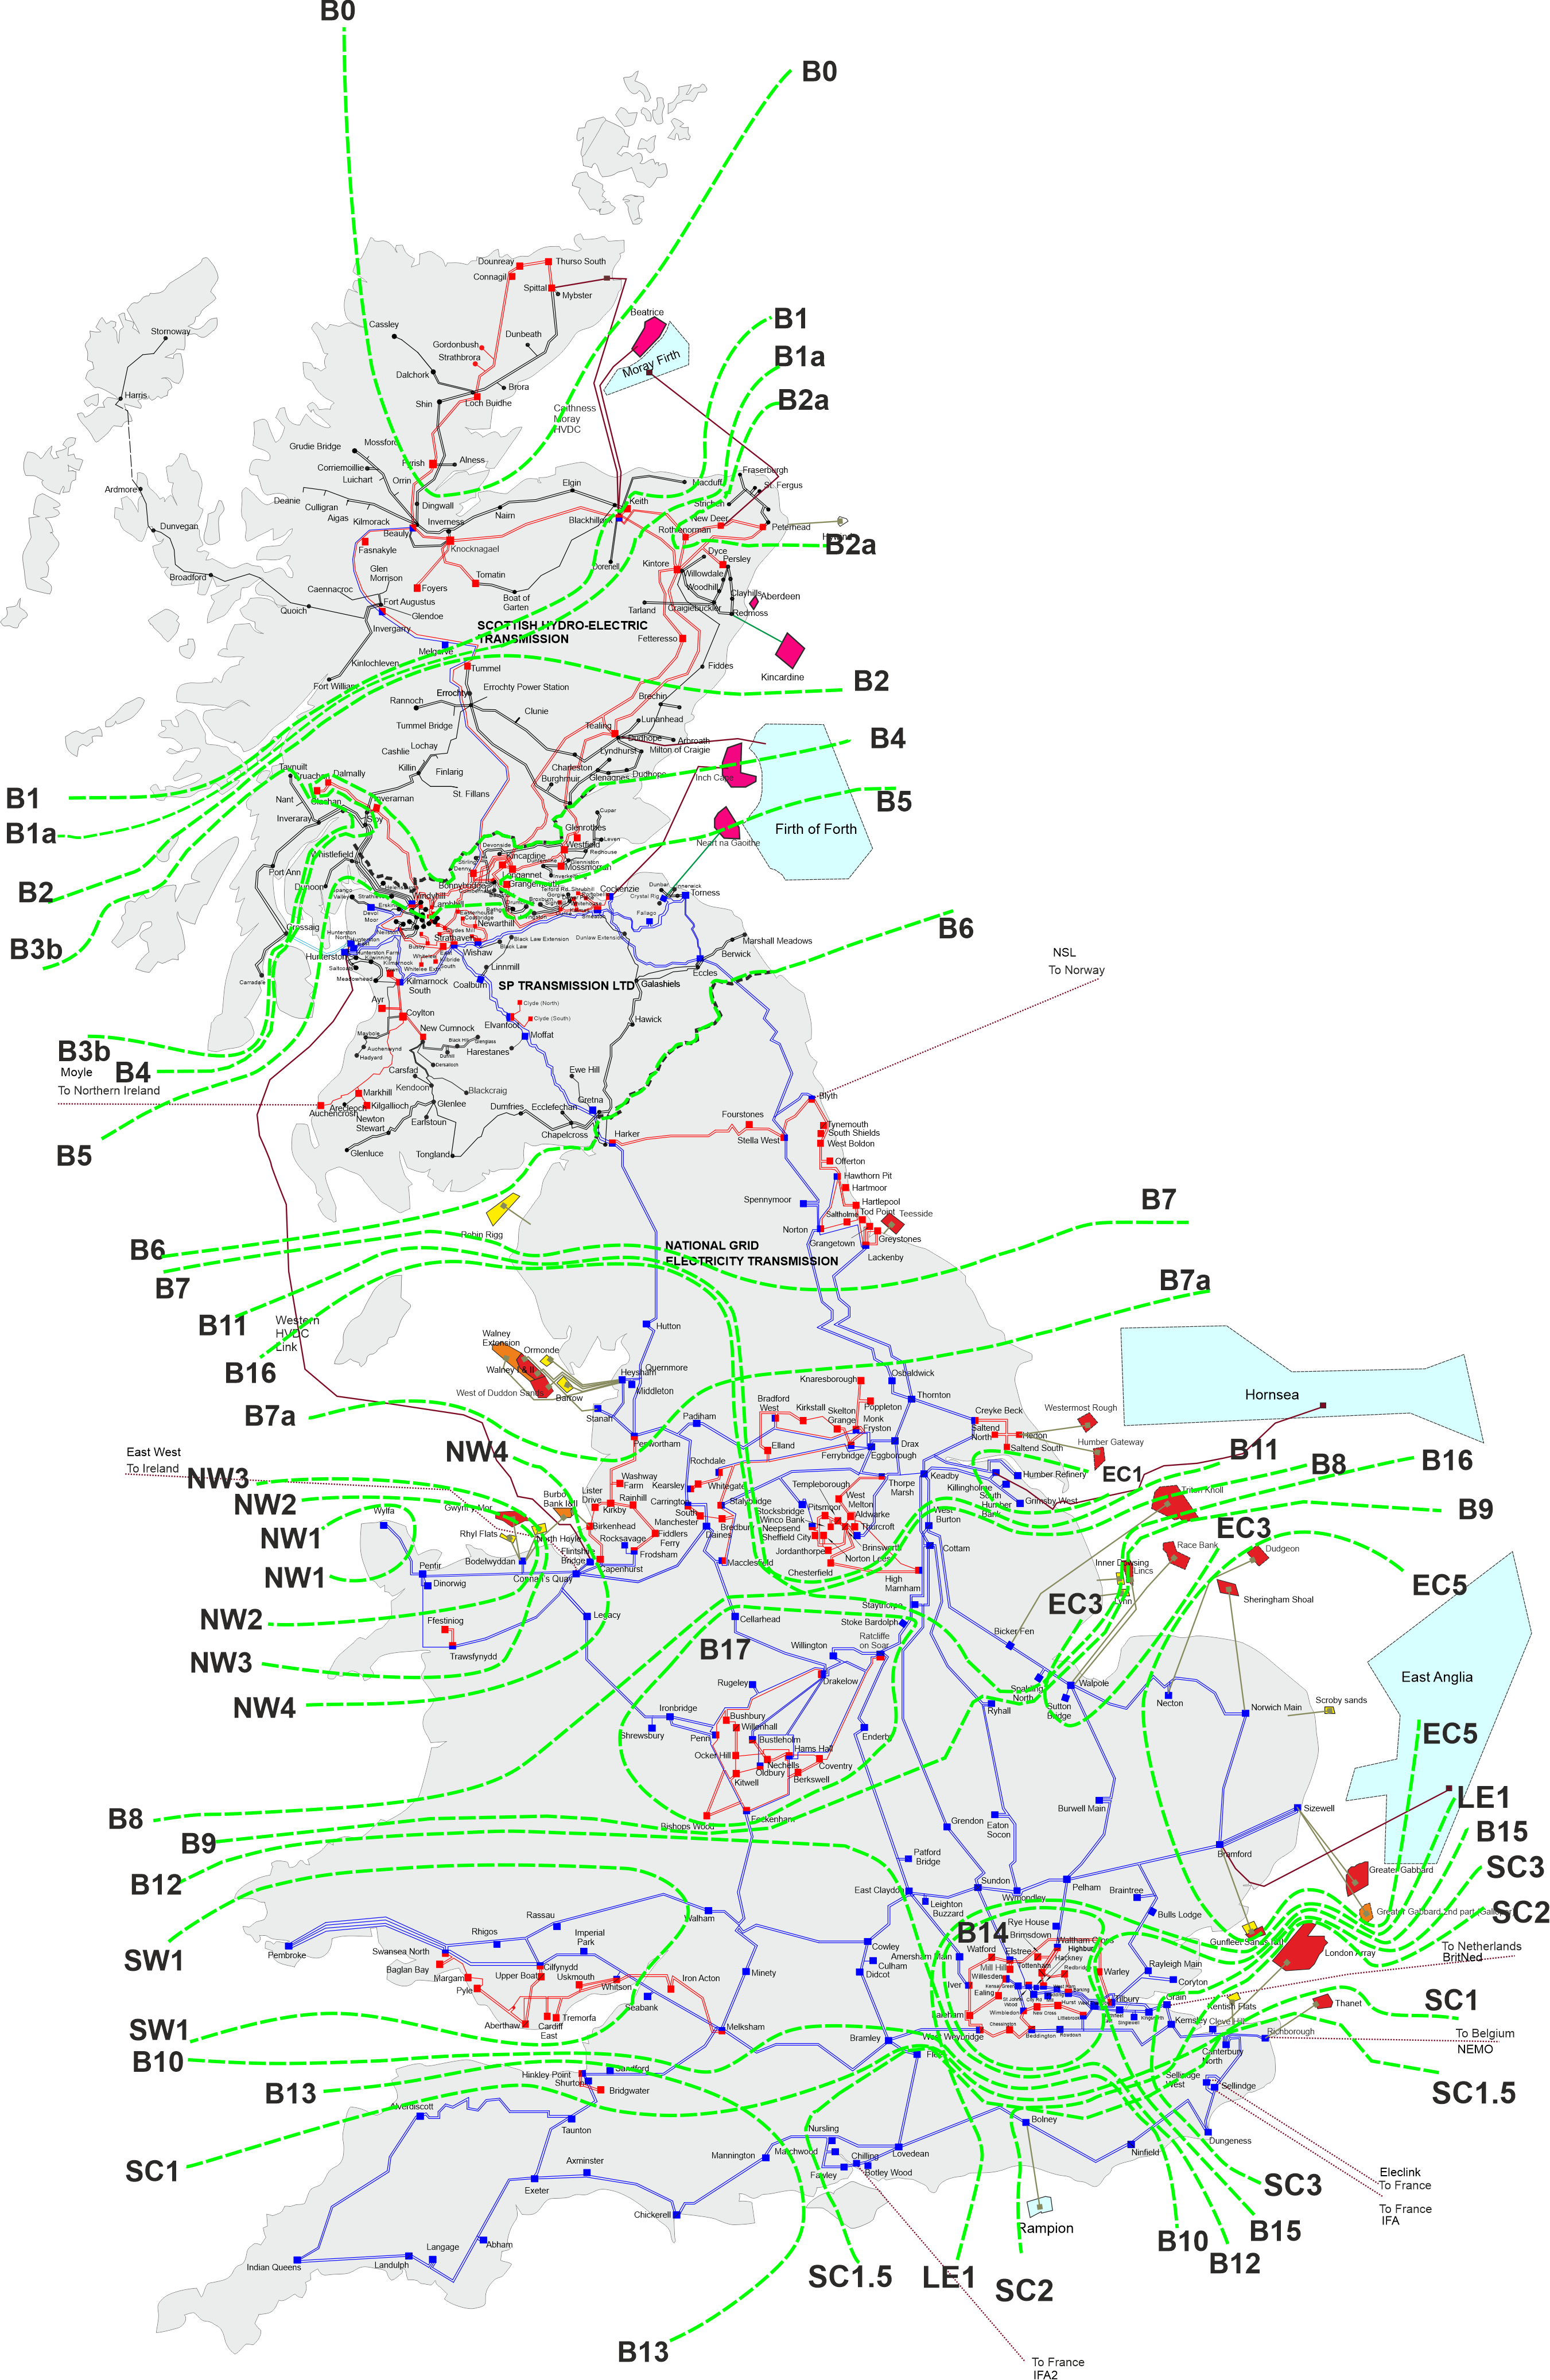
Download a larger view of the map
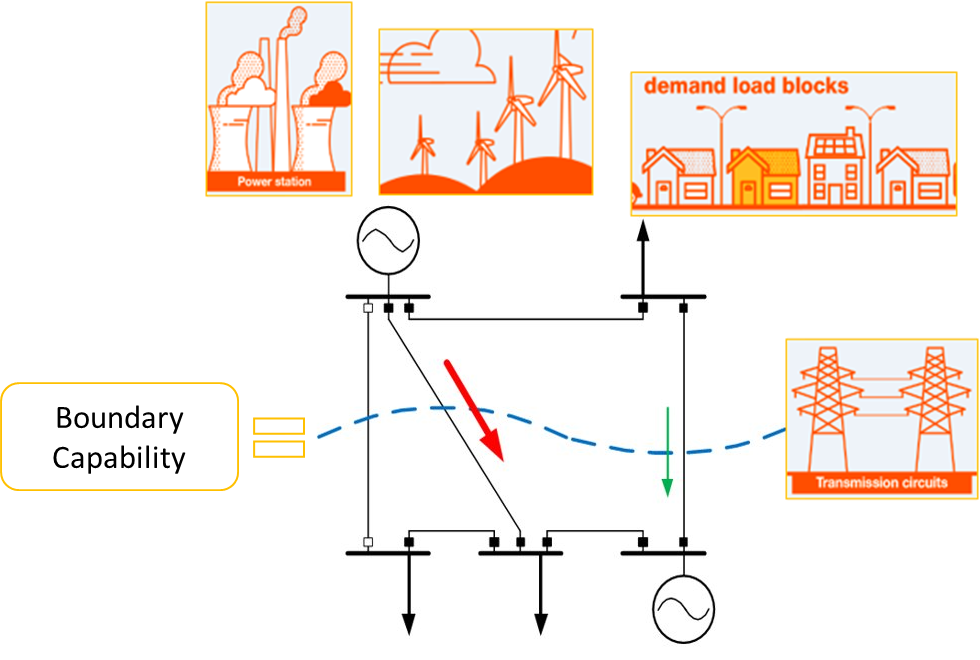
Determining boundary capability
The boundary capability is the maximum MW flow that can be transferred across a boundary while maintaining compliance with the NETS SQSS.
ETYS capability is only presented for year one as a check against SQSS planning compliance. When we assess future requirements, we bear in mind that we have many signed contracts for new generation, demand, and interconnectors seeking to connect to the NETS.
We do not know precisely how much new capacity there will be, when it will connect, or when existing generation will shut down. Our FES provides four credible scenario pathways to 2050 and we use these to identify expected future boundary flows as required by the NETS SQSS.
For each boundary, we work with the transmission owners to undertake power system analysis to determine the boundary capability.
Limiting factors on transmission capacity include:
- Thermal circuit rating
- Voltage constraints
- Dynamic stability
For the ETYS network assessment, contingencies are applied, and the most severe limitation is used to determine the network boundary capability. The base capability of each boundary can be seen in the Electricity Transmission Network Requirements section.
How do the ESO manage voltage?
To keep voltage stable, we can increase it by injecting reactive power and decrease it through absorption of reactive power. Power stations provide reactive power services when they are generating electrical power. The electricity system itself can also be used to provide reactive power; this could come from reactive equipment, or from the electrical properties of cables and overhead lines. In the past, the ESO mainly used to take action to manage low voltage. However, now there are fewer industrial processes and spinning turbines, we mainly manage voltage when it is higher than normal.
Our voltage screening analysis is new for the ETYS this year as we integrate the work from our traditional separate report into our main publication. Voltage needs on the NETS will be communicated on our regional drivers section, within Electricity Transmission Network Requirements.
Our voltage screening methodology
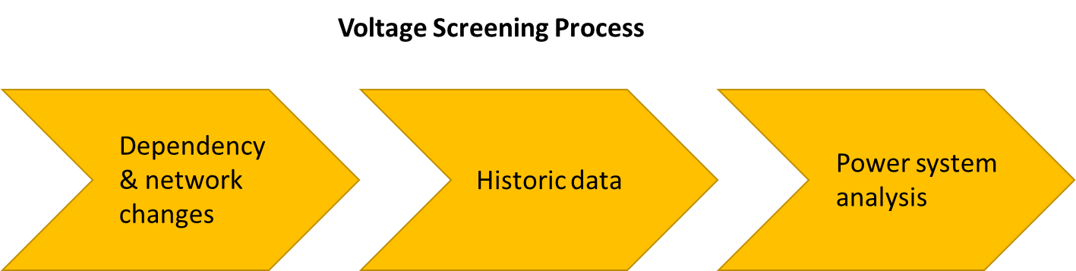
Our screening process is published in chapter 5 of our NOA methodology as part of the high voltage management process. The screening process is the first step in the overall process, and it identifies and prioritises the region(s) which should be further explored with detailed power system studies. Following detailed analysis the priority of some identified regions could change. System needs confirmed through detailed analysis could lead to competitive network service procurement. The screening process is set out in the charts below.
Voltage is a localised property of the transmission system determined by configuration of the local network and the nature of generation and demand in a region. Unlike real power, reactive power has a localised effect, so voltage control measures are most effective when applied closer to the problem. These issues can therefore be grouped into regions, with an assessment of each conducted separately.
Dependency and network change identification: When a plant is utilised frequently to provide voltage support, its scheduled closure may increase difficulty in keeping the network voltages within SQSS limits. Our screening process identifies any of these dependencies, alongside the potential impact of future network changes or the variation of generation and demand forecasted in the FES.
Historic data analysis: In our role as the ESO, we collect vast quantities of commercial and operational data from supervisory control and data acquisition (SCADA) and other metering systems across the country. Areas of high historic spend, combined with frequent large voltage excursions will be highlighted as part of the screening process. The root cause of any voltage issues are analysed more in-depth through post-fault analysis.
Likelihood and lead time: As part of the screening process, the conditions under which high-voltage issues arise are analysed and their likelihood is assessed. This helps determine whether identified voltage issues are likely to persist into the future or driven by one-off events.
Our ambition is to communicate a long-term view of year-round stability needs in future ETYS publications, with more specific procurement needs communicated through our stability market, which is still under development.
Further work is still ongoing to develop tools and techniques to allow year-round long-term stability analysis (via automation). While we develop our analytical capabilities, we will continue to communicate stability needs when they are identified via our dedicated stability pathfinder page. Once our tools and processes mature, we will integrate a long-term view of stability needs within ETYS.
Pathfinders update
To support the ESO’s ambition to operate the NETS at zero-carbon from 2025, the ESO has launched stability pathfinders to deliver necessary changes to the network. As part of the third phase, the ESO has secured new contracts worth £1.3bn to provide network stability services without the use of carbon over these periods. These contracts represent a cost benefit of £14.9bn between 2025 and 2035.
Read our article on stability pathfinders
Y-1 Stability Market
In 2021, we launched the Stability Market Design innovation project to explore the optimal design for enduring stability markets, with a focus on value for consumers. As a result of this work, in the April 2023 Markets Roadmap we set out the proposal to procure stability services across several timescales:
- Long-term Y-4
- Mid-term Y-1
- Short-term D-1
The first step to launch the Stability Market is to initiate the mid-term (Y-1) market, with the intention to undertake the first mid-term (Y-1) tender round later this year (2023). Our latest modelling indicates that in many circumstances across the next few years, the requirement to maintain system stability can be met through a combination of self-dispatched generation, demand, and Stability Pathfinders. For the remaining periods, we have identified an opportunity to optimise how stability is secured through the mid-term (Y-1) market and deliver consumer savings versus the alternative actions currently available to us.
Innovation projects
New NIA stability project, STARTZ – Stability Requirements Calculation Towards Net Zero
Current stability calculation methods use a number of assumptions and approximations, and there may be room to make the process more accurate. This project reviews the ESO’s stability requirement calculations and explores the potential for new methodologies, machine learning, and automation to enhance accuracy and efficiency to inform procurement market activities and future network planning. Suggested improvements to the methodology will be tested and validated against detailed system modelling.
This project will support the energy transition by ensuring the grid remains stable while more renewable generation is integrated into the network. It will provide value for money for consumers as there is less variance in our estimates, so the balancing services required will be more accurately predicted and procured. The potential to use automation and machine learning to calculate stability needs will make the process more efficient and reduce the risk of human error which could affect the results.
NOA enhancement stability project
The NOA Enhancements project is looking to improve the current NOA process and assess more systems needs with more granularity. We have reviewed our current processes for stability assessments across ESO and have launched an IT project to develop a product to enable us to do more analysis in less time.
We are working to develop automation tools for assessing future stability requirements more frequently and consistently. This includes three main modules:
- a system inertia calculation for the future years based on the published FES scenarios
- a module to measure short-circuit ratio in grid system as one of common metrics of system strength, which could help highlight weaker regions of the network and be a useful indicator for managing system strength in both planning and operational time scale
- a rotor angle stability screening module to quickly identify unstable snapshots in future years