Electricity Explained
Britain's Electricity Explained: 2023 Review
9 Jan 2024 - 3 minute read
We’re moving closer to our ambition of periods of zero-carbon operations by 2025 and hit some…

1 Nov 2021 - 2 minute read
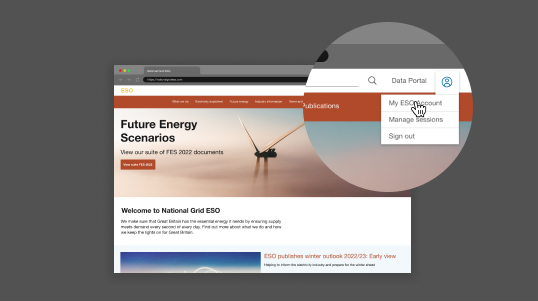
National Grid Electricity System Operator (ESO) has launched a new data dashboard tracking Britain’s progress towards zero carbon operation of the grid.
As the COP26 climate conference gets underway in Glasgow, ESO’s real-time view of electricity system data and historical carbon intensity shows how the country has decarbonised during the last decade – the data is even powering a display in 10 Downing Street throughout COP26.
Carbon intensity is the measure of CO2 emissions per unit of electricity consumed, and is the best indicator of how clean Britain’s electricity is.
The country’s carbon intensity has reduced by over 65% since 2013, from an average of 529 gCO2 of emissions to just 181 gCO2 in 2020 – the greenest year on record. Easter Monday this year saw Britain’s electricity at its cleanest ever, with a record low carbon intensity of 39 gCO2/kWh.
By 2025 ESO expects to be able to operate the electricity system entirely with zero carbon power for periods of time, and with zero carbon power 100% of the time by 2035.
As well as tracking the country’s live generation mix, ESO’s new dashboard shows a real-time breakdown of electricity imports from the countries Britain is linked with via subsea interconnectors – including the carbon intensity of imports from each country.
In another step to improve transparency around system operation, ESO is also publishing the carbon intensity of its balancing actions for the first time.
That means whenever ESO’s control room requests for a power source connected to the grid to ramp up or down to help keep the system stable and in balance, the dashboard is measuring the carbon difference compared with the original market position.
Matt Magill, zero carbon operation senior manager, said:
Our new carbon intensity dashboard reveals some fascinating data on our power mix, and how it’s changing as more clean energy sources connect to the grid. We’re particularly excited to share a new level of insight into the impact of our balancing actions as Britain’s electricity system operator.
As the country decarbonises, it’ll be more important than ever to understand the impact of these actions to keep electricity flowing safely. We expect to see the carbon intensity of these actions reducing as our new innovations and technologies mean less intervention is needed to secure a greener system.