
Future energy
The critical role of innovation in delivering a net zero…
27 Mar 2024 - 2 minute read
Read our Innovation Strategy to learn how innovation is critical to address the challenges of…
1 Nov 2021 - 4 minute read
It’s our goal as Britain’s electricity system operator to be able to run the grid entirely with clean power, for periods, by 2025. As we launch a new carbon intensity dashboard, our zero carbon operation expert, Matt Magill, explains how we’re tracking our decarbonisation progress.
It’s our goal as Britain’s electricity system operator to be able to run the grid entirely with clean power, for periods, by 2025. As we launch a new carbon intensity dashboard, our zero carbon operation expert, Matt Magill, explains how we’re tracking our decarbonisation progress.
The events of spring 2020 sent our control room into the near future.
Low demand in lockdown, and high wind and solar generation, saw our experts up against a challenge we were expecting five years down the line: operating a system which often had a near 100% zero carbon electricity mix.
While it’s our ambition to be able to do that by 2025, the system we operate today isn’t ready to run purely with clean energy (though it’s not far off).
Throughout that challenging 2020 period we regularly had to take action to make sure we kept the country’s electricity supply stable and safe – and that meant pulling zero carbon generation back to make way for some carbon-emitting plants.
One example was on May 23 2020 – illustrated in the graph below – which we describe in more detail in our latest operability strategy report.
We did this to manage particular stabilising properties of the electricity system, notably inertia and voltage – properties which the likes of wind power cannot readily provide because of how and where it connects to the grid.
It was an intervention we’ll be making less and less frequently as we bring in new innovations and technologies – for example our stability pathfinder work and new inertia measurement tools – to make the grid ready for 100% zero carbon.
Whether we’re operating with zero carbon or not, our job will always be to make sure the lights stay on.
As we get closer to 2025, and as the UK closes in on its legally-binding emissions reduction targets, it’ll be more important than ever to understand the impact of any action we take to keep electricity flowing.
That’s why we’ve introduced two new metrics: the carbon intensity of our balancing actions, and the proportion of zero carbon power before and after we intervened.
It means whenever our control room requests for a power source connected to the grid to ramp up or down, we’re measuring the carbon difference compared with the original market position.
This is an exciting development, providing unprecedented transparency around and insight into our actions – and how close we’re getting to zero carbon operation.
Let’s have a look at the metrics in a little more detail:
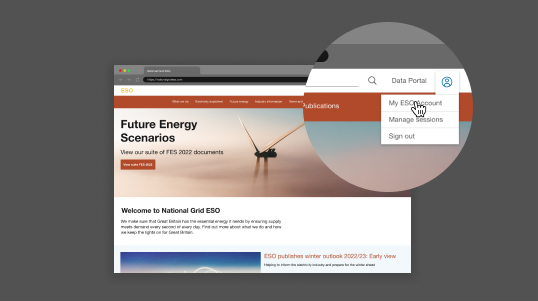
Available to view through our brand new carbon intensity dashboard, this measures the difference between the carbon intensity of all the generators in the balancing mechanism before and after our balancing actions have been applied. It includes balancing mechanism generators connected at both transmission (national) and distribution (regional) level, with a carbon intensity factor applied to each fuel type.
The graph below shows the impact on carbon intensity of our actions each hour across a day last week.
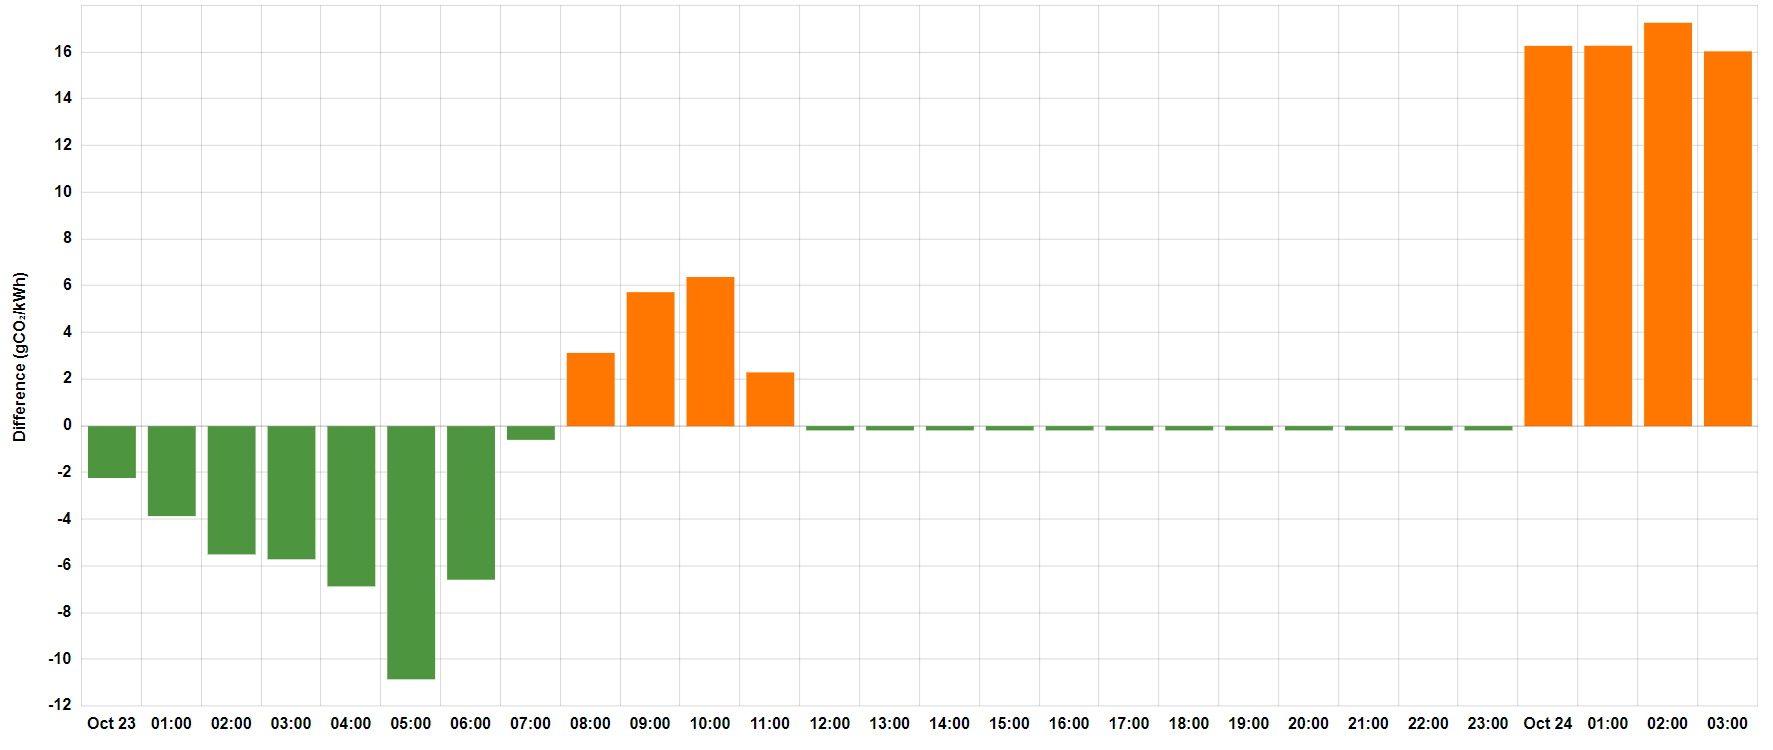
While our balancing actions will often increase the carbon intensity of the generation mix, we expect to see this happening less as we move towards 2025, as our new innovations and technologies mean less intervention is needed to secure the system.
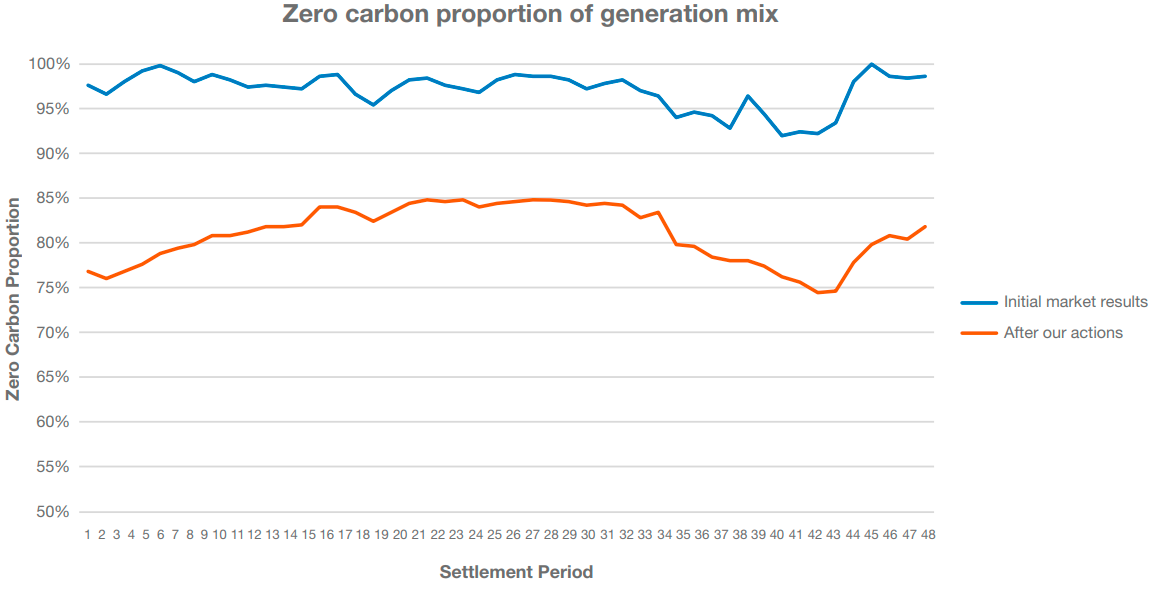
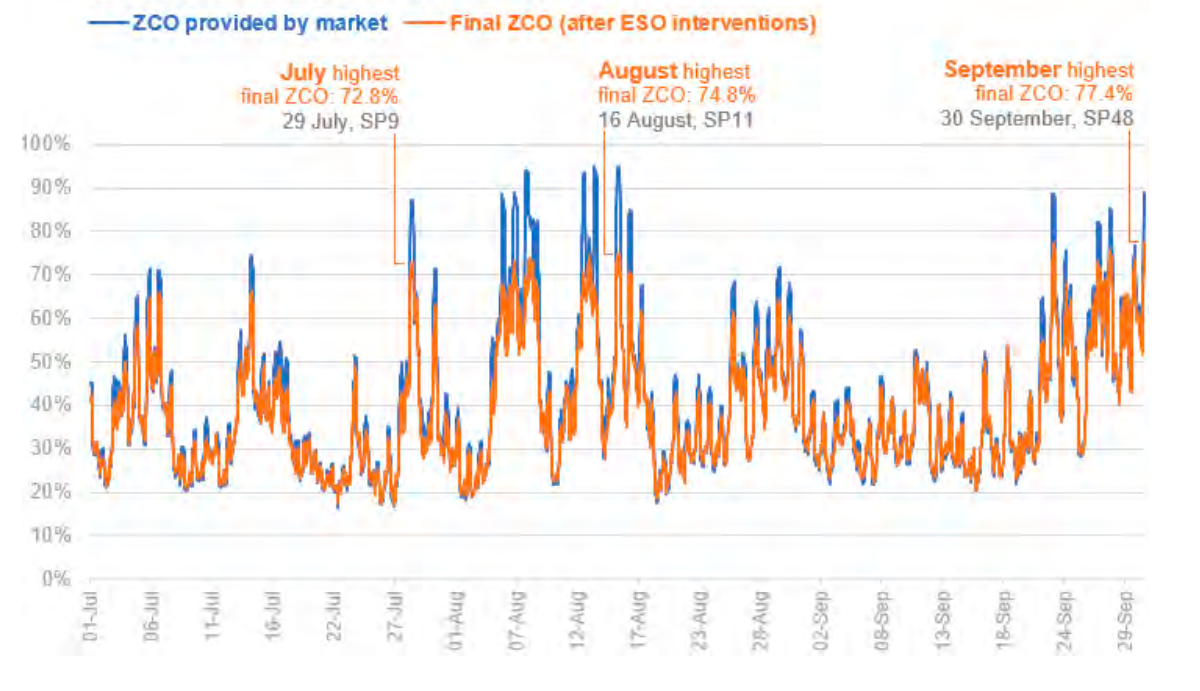
Reported through our regular performance documents, this metric shows the proportion of zero carbon generation in the mix that was available from the market, and the difference following our actions.
When the post-action figure hits 100%, we’ll have operated Britain’s electricity system carbon-free for the first time.
The graph below shows actions we took over summer to secure the system, which on occasion was being presented with over 90% zero carbon power from the market.
We expect both these measures to return record-breaking figures with more frequency as we move towards 2025 – our zero carbon ambition means getting the ZCO figure to 100% as often as possible.
There are challenges ahead, and much to do to make Britain’s electricity system ready for that first hour of zero carbon operation.
But it’s an incredibly exciting time for energy in this country – particularly with COP26 now underway – and through metrics like these, we look forward to sharing our progress in the transition to a carbon-free electricity system.