
Future energy
The critical role of innovation in delivering a net zero…
27 Mar 2024 - 2 minute read
Read our Innovation Strategy to learn how innovation is critical to address the challenges of…

1 Dec 2020 - 5 minute read
Our Future Energy Scenarios examine different pathways the energy system could take between now and 2050. Each scenario sees 30 years of change with more electric vehicles, renewable energy and different ways of heating our homes. Strategy Manager Rob Gibson explains our assessment of the relative costs of each of these scenarios.
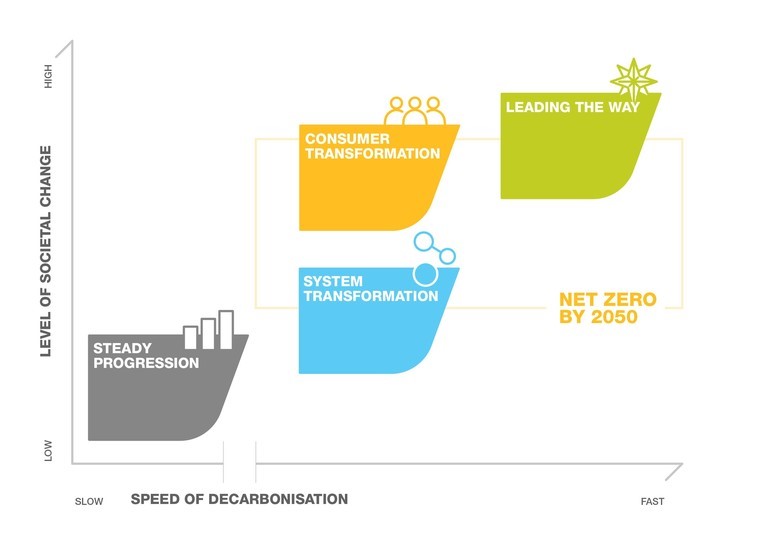
Each year we produce four Future Energy scenarios - different pathways for the future of energy over the next 30 years. They are aimed at informing industry investment and supporting decisions on energy policy.
The potential changes to the energy sector are illustrated across the different scenarios, including assumptions around deployment of renewable energy, take up of electric vehicles, and investment in new technologies such as hydrogen and carbon capture technologies too. In three out of the four scenarios Great Britain achieves its Net Zero by 2050 target.
Although these are not firm predictions, we talked to over 600 industry experts to build this insight. Nevertheless, estimating the costs of scenarios 30 years into the future with accuracy is difficult given the level of uncertainty around new and emerging technologies, and changes in the economy and people’s behaviour.
Given the difficulty there are few other similar bits of analysis looking at total costs, the Climate Change Committee does produce estimates of the additional costs of meeting the UK’s climate targets, compared to a world with no further climate action from today.
The aim of our project was to cost the scenarios for the energy sector to enable comparison across these four Future Energy scenarios. Importantly, our project doesn’t provide the total cost of meeting net zero to UK Plc and does not include costs related to energy demands from a number of areas such as aviation, shipping, rail, agriculture and industrial and commercial heat demand.
The costs on their own are large but it’s important to put them into context. The energy system is vast and complex and the scale and importance of its operation means the costs involved are sizeable. Therefore, significant costs will be incurred across the energy system between now and 2050 in any event and the key insight we are providing here is enabling a comparison of what those costs might be under different assumptions, or in different scenarios.
It’s also acknowledged that Net zero could bring wider societal benefits, for instance to human health as a result of improved air quality and a better-protected natural environment. The Climate Change Committee outlined some of these opportunities and wider savings, including for instance by reducing hospital admissions and enabling people to be more productive. Further, in November 2019, the Treasury launched a review into the costs and opportunities of reaching net zero which is due to report later in the year.
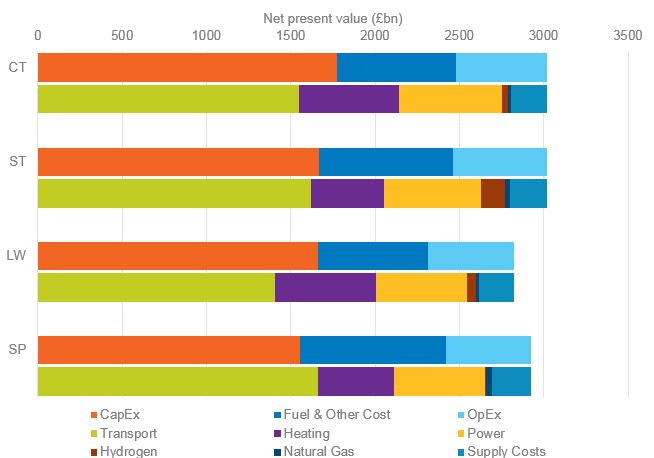
The final Net Present Value costs under each of the scenarios, as seen in the chart below, are broadly similar (Leading the Way £2,820bn, Steady Progression £2,930bn, System Transformation £3,020bn and Consumer Transformation £3,020bn), with only a 7% difference across the scenarios which is considered small when compared to the margin of error in producing these forecasts. This shows that the scenarios where we hit Net Zero in 2050 (or earlier, in Leading the Way) incur broadly the same costs as the scenario where we miss our Net Zero target (Steady Progression). Also, the annual spend is similar in all years between 2020 and 2050 across the majority of scenarios.
For the analysis team it’s really pleasing to see this economic analysis support the key messages outlined in the main FES document released earlier this year, with many of the key themes appearing in both.
The analysis indicates that costs are lower when consumers are engaged, energy efficiency is pursued, and negative emissions are compensated. It’s the FES Leading the Way scenario which has the lowest overall cost, driven primarily by significant changes to transport and residential heating, with consumers adopting electric or autonomous cars for example, and negative carbon emissions from the power sector.
In transport a significant reduction in the number of cars on the road reduces expenditure. Between 2045 and 2050 Leading the Way sees many homes opt to have one or no car relying on shared transport, leading to one third fewer cars in 2050 than Steady Progression (20 million cars versus 33 million cars) and this factor alone gives a £27bn annual cost reduction.
In heating, Consumer Transformation (CT) and Leading the Way (LW) both have high levels of insulation and favour heat pumps (including hybrid heat pumps). These are more expensive technologies to install but with insulation do drive reduced heating costs.
The target of net zero homes by 2045 in the Leading the Way scenario leads to a rapid reduction in cost of around £29bn in residential heating costs over the following five years.
In the power sector there is more investment in new renewable electricity generation assumed in the three net zero scenarios. In these scenarios there is also assumed revenue from negative emissions produced by Bio Energy plants combined with Carbon Capture and Storage (BECCS).
Estimating the costs of the four scenarios is a challenging but a hugely interesting project. Even though this is not a total cost of Net Zero, it is evident from our analysis that the scenarios that deliver Net Zero do not result in a material increase in costs over the scenario where Net Zero is not met by 2050. Further the analysis reinforced the message that consumer engagement is critical to meeting Net Zero at lowest cost – from embracing energy efficiency technology such as heat pumps to the continued uptake in electric vehicles.
We hope this analysis is useful for stakeholders across the energy industry and beyond and look forward to hearing feedback on our work.